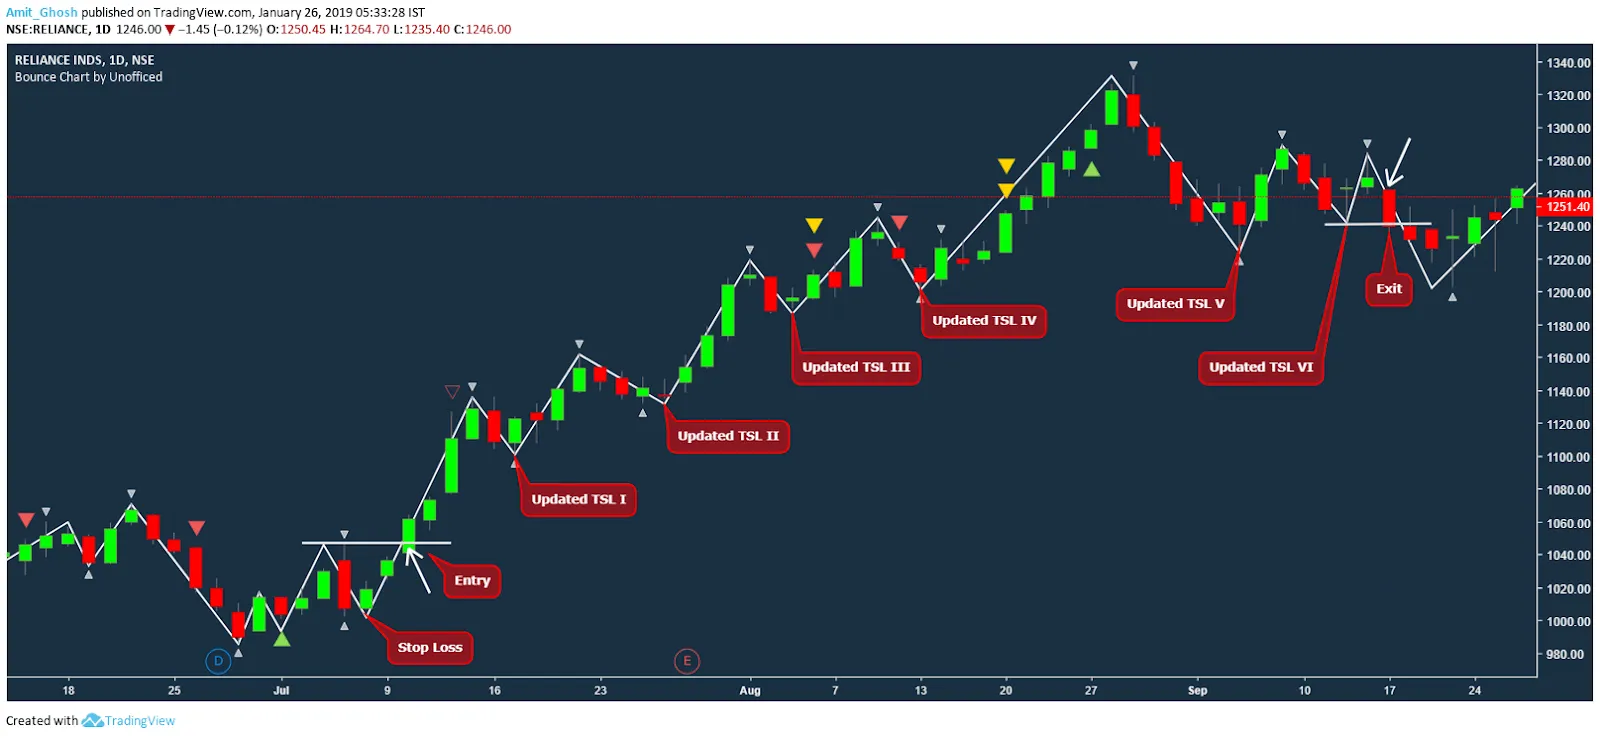
Trailing Stop Loss

Majority of Traders and Investors use Swing Highs as a trailing stop loss.
When you’re in a long position and you want to lock in your profits by updating your stop loss at an upper level to trail the price. One of the ways to do this is to set the stop loss to the last Swing Low. When a stock moves in a trend, it always retraces before moving up higher.
After prices rally from a retracement, you can move your stop to the newest Swing Low when prices move up to a new high in the trend. You can repeat this process until you are either stopped out or reach your target.
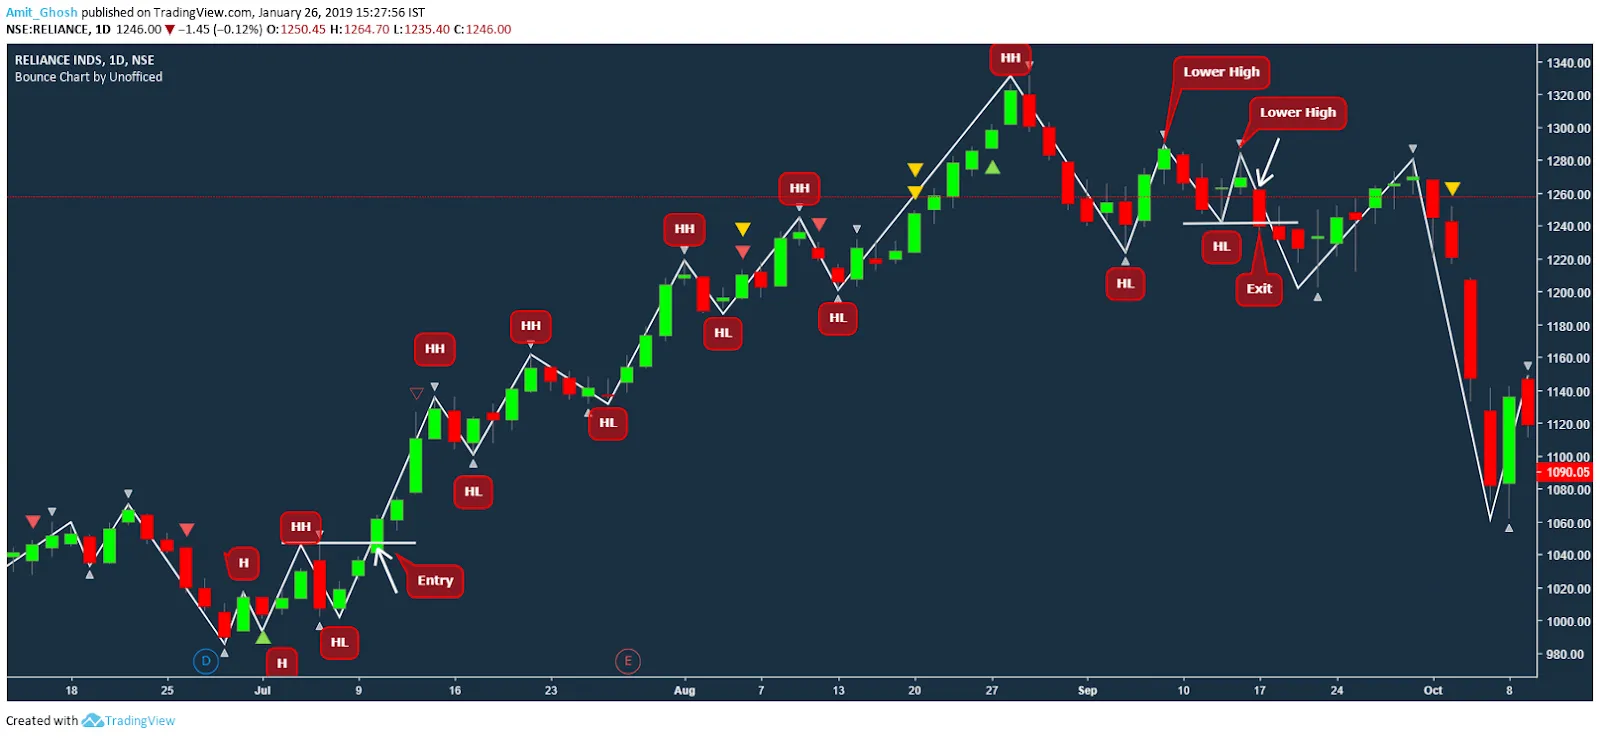
A stock is considered to be in an uptrend when it makes consistent higher highs with higher lows. Once this is broken; the stock is said to have broken the uptrend! It may also happen, instead of Higher High, Lower High is formed. It means the uptrend is weak. But, as long as Higher Lows are formed; trade goes on.
Now, if a Swing Low is broken, then the definition of an uptrend, itself gets broken and one should not be in a long position anyway.
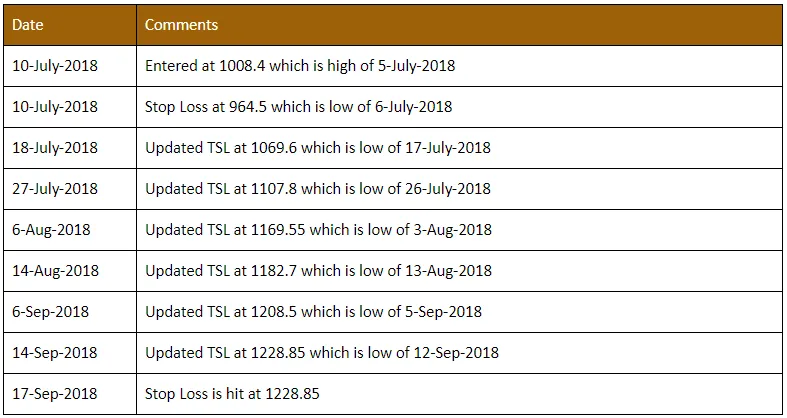
We’re netting a profit of (1228.85-1008.4) = 220.45 points which is roughly 21.86% from our entry point. The risk taken here is the initial stop loss i.e. (1008.4-964.5) = 43.9 points which is roughly 4.35%. After the initial stop loss update, the trade becomes risk-free!
Let’s summarize the whole trading activity in our aforesaid plan –
However, one can also spot the weakness ahead. Before hitting the trailing stop loss, the uptrend stopped to make Higher Highs and made couple Lower Highs as marked here –
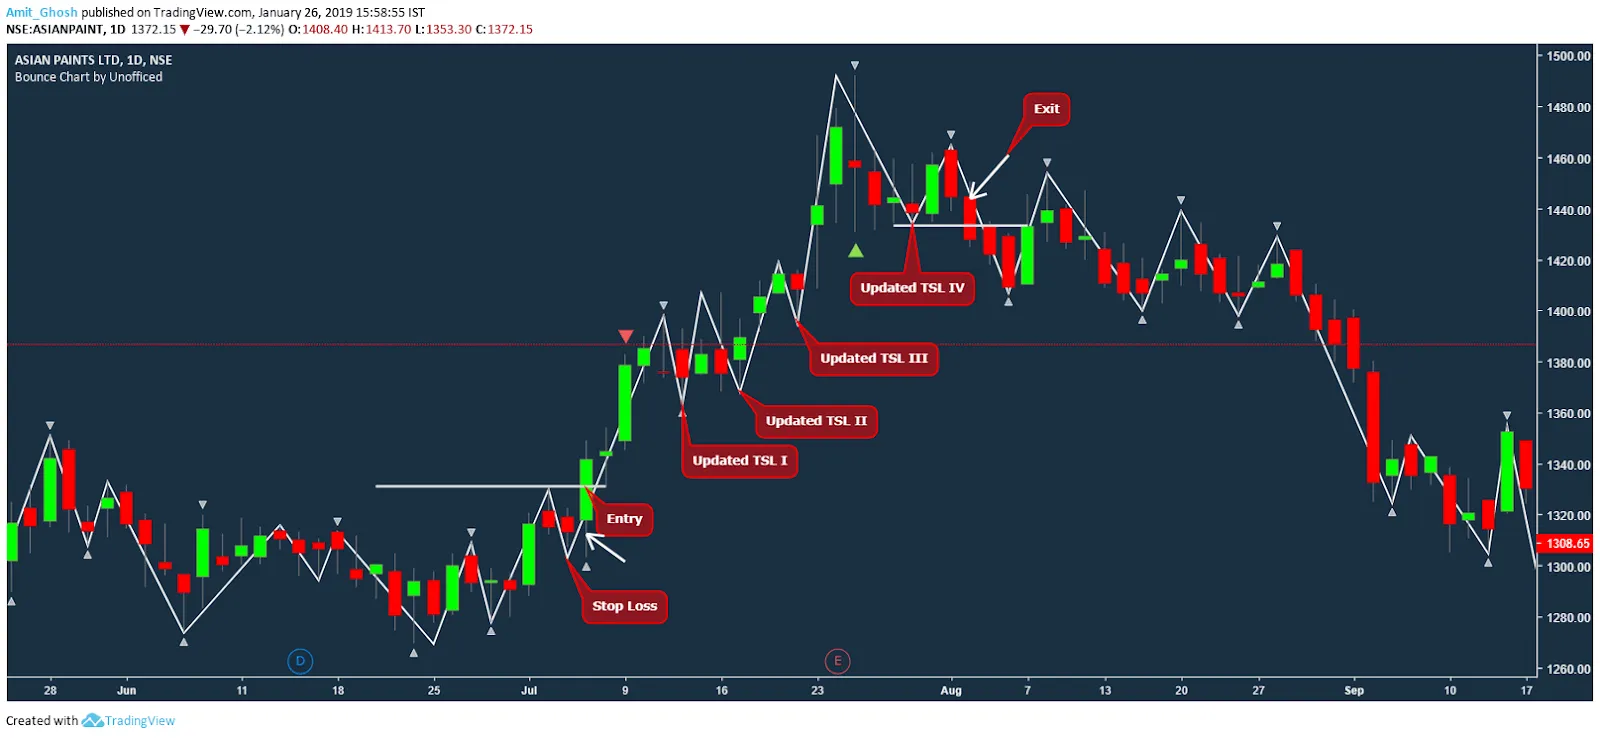
Here goes another example from Asian Paints –
Here we shall be discussing fives cases –
- A scrip which is/was in perfect uptrend.
- A scrip that is about to trigger buy in an uptrend.
- A scrip that is in an uptrend in the smaller time frame but the same scrip is in a downtrend in the higher timeframe.
- A scrip that is in an uptrend in the smaller time frame but the same scrip is in a sideways trend in the higher timeframe.
- A scrip that is in an uptrend but it broke one higher low and then resumed the uptrend.
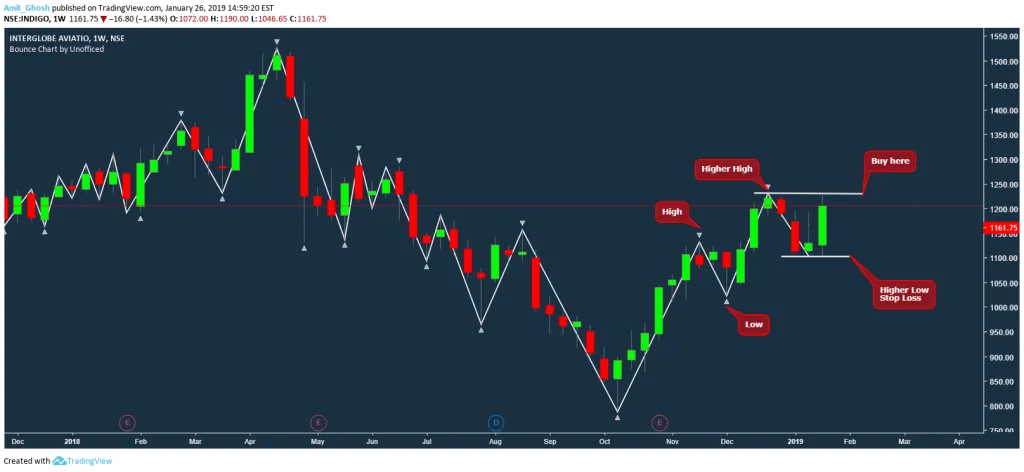
Source: https://in.tradingview.com/chart/INDIGO/hFQSR78f-Positional-Buy-Indigo-Bounce-Uptrend-Trade/
Here is a case of an uptrend in the weekly time frame as seen in Indigo. This trade is already triggered. The Higher High was at 1188 and it made a high of 1190 in the last week!
The lowest point is the Higher Low i.e. 1046.65 is the stop loss