Swing Charting

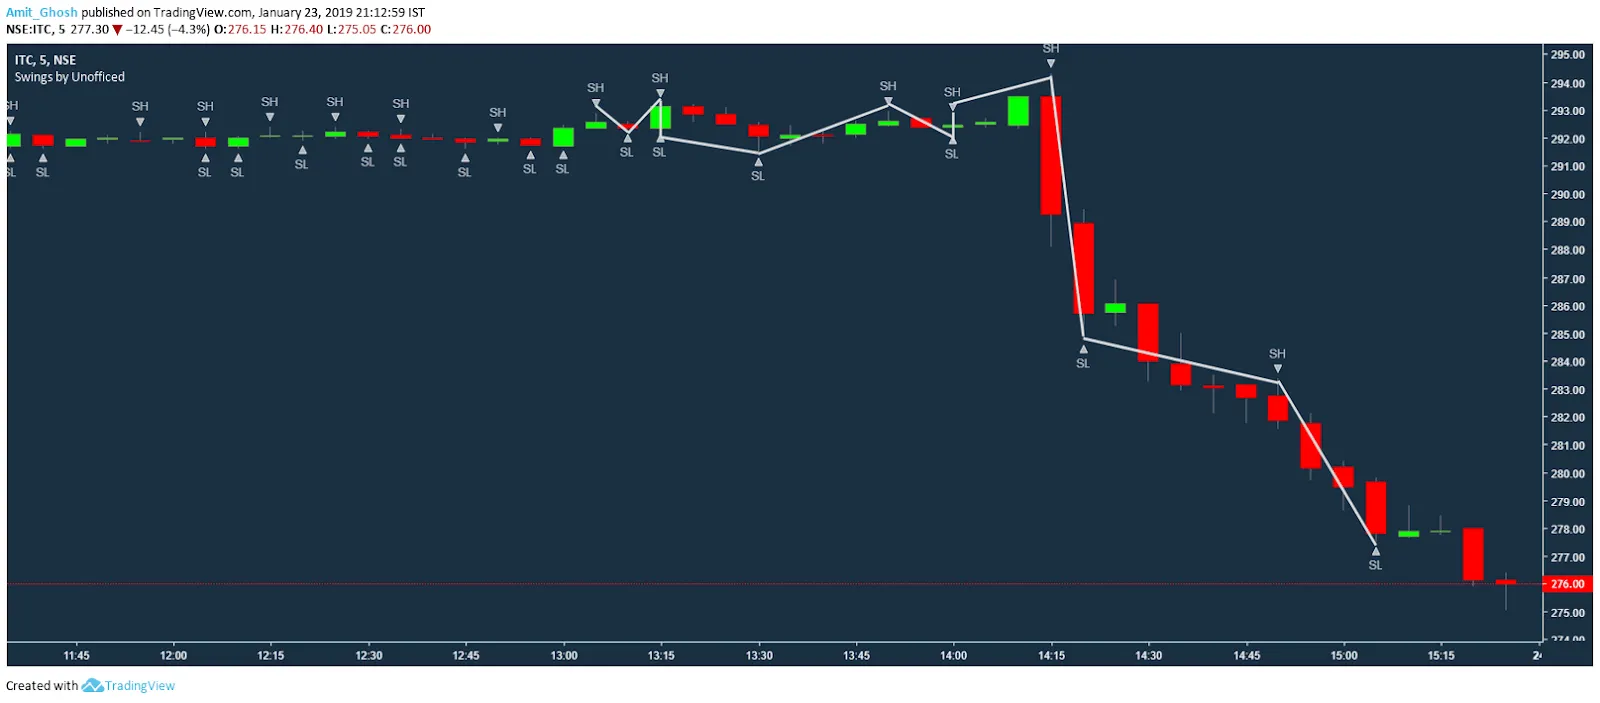
If we connect the Swing highs and Swing lows in the following chart we will have several problems as one can see –
- Swing High and Swing Lows are not coming alternately.
- Same candle can be Swing Low and Swing High at the same time.
- Swing High formed after a Swing Low can also form lower than the Swing Low.
Also, if we plot peaks and troughs, we are experiencing the same problem.
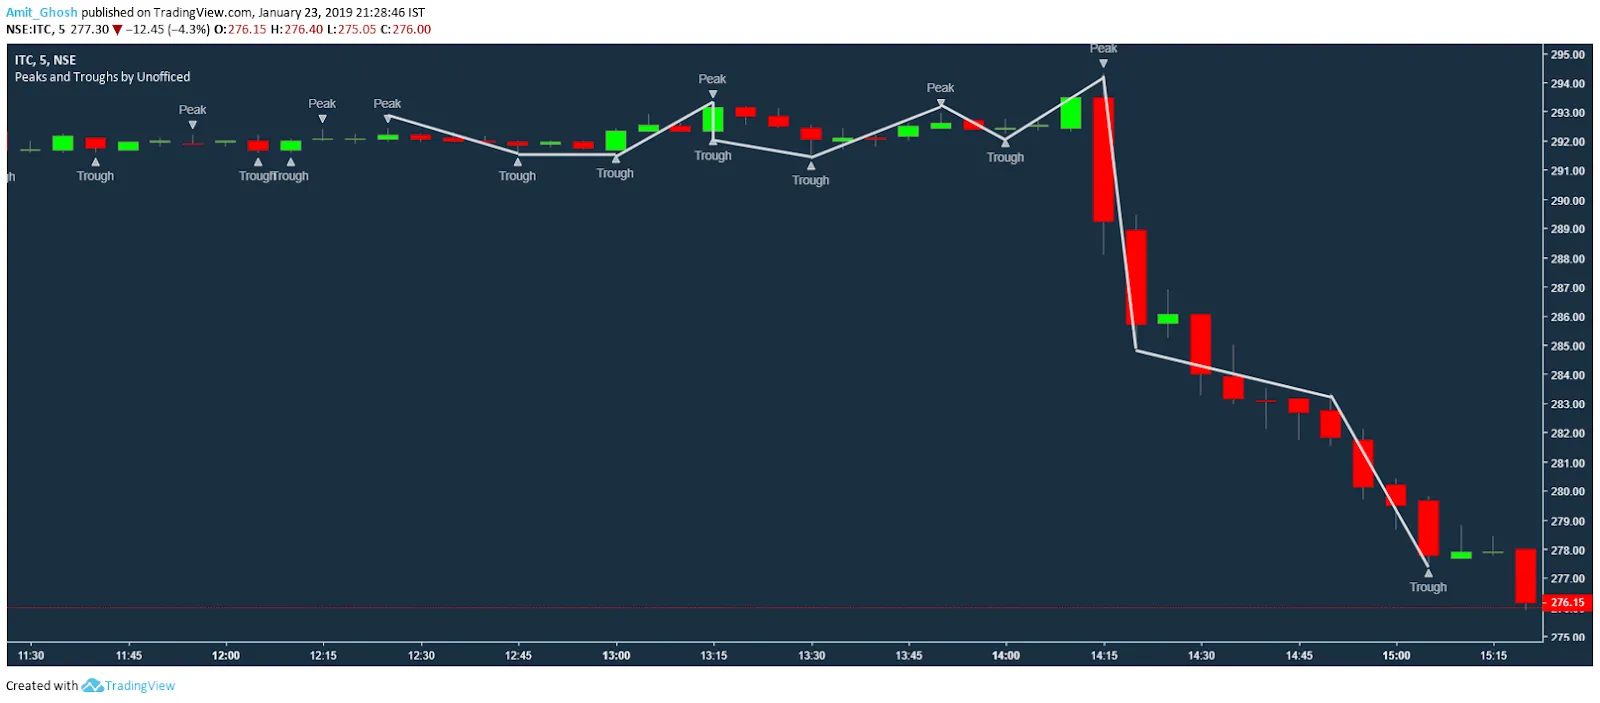 It looks baseless to gauge any trend here because we are unable to define higher high and higher low relative to anything here. But if we make certain rules like –
- After finding a peak, skip all the peaks in the middle until you find another trough.
- After finding a trough, skip all the troughs in the middle until you find another peak.
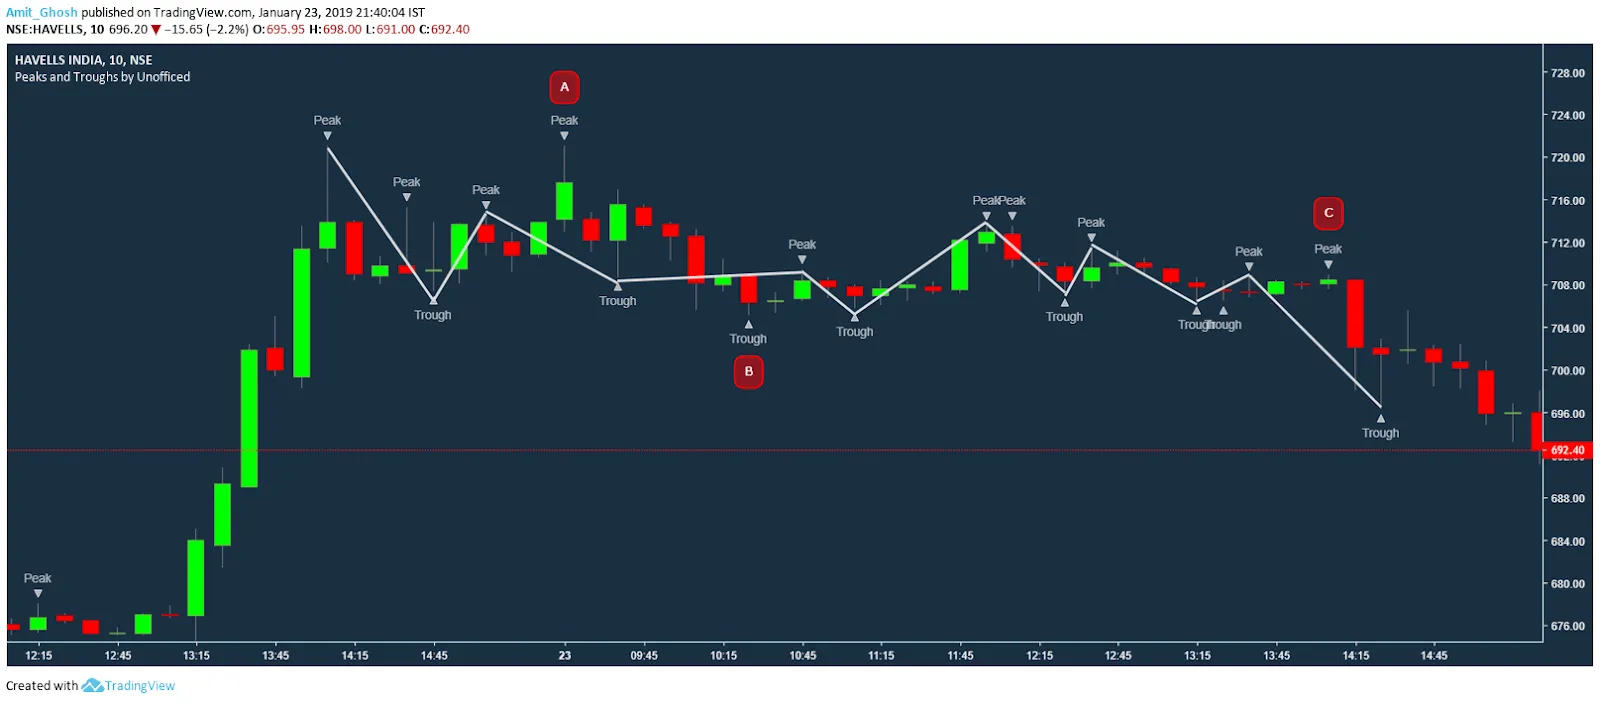
Now, this looks excellent.
But, still, there are some problems if we see the candles marked as A, B and C closely. In the case of candle A, that candle is a peak which is discarded because we were seeking a trough! But this is higher than the previous peak.
Hence, it is more important as shorters will keep a stop loss at the high of this candle. The previous peak won’t matter! To remedy that, Let’s add a couple more rules –
- Between many consecutive peaks, always take the highest peak!
- Between many consecutive troughs, always take the lowest trough!
Apply these new rules to the above chart, we get –

This looks perfect! Now one can define trends using this chart. If the peaks and troughs marked here are making higher highs and higher lows, we can tell the scrip is in an uptrend in this time frame. Let’s discuss on defining this part properly later on.
This chart is called the Swing Chart. The stock is bouncing/swing from the swings. It is great as it simplifies the process of locating a trend. Also, it reduces the noise from the market.
The line is called a ZigZag line.
There are several variations of Swing Charts. Later, we shall discuss another method of Swing Charting which reduces even more noise from the market than the above-discussed one.
Pine Scripts
It is hard to find any indicator that adores the same thought process of swing trading. So, We’ve coded the indicators in Pine Script which is developed by Tradingview.com,a charting platform. Anyone can apply the indicator and, view the source code as well.
- Swings – https://in.tradingview.com/script/oO15s0J8-Swings/
- Perfect Swings – https://in.tradingview.com/script/AqMmN25j-Perfect-Swings/
- Peaks and Troughs – https://in.tradingview.com/script/mmToAAti-Peaks-and-Troughs/
- Bounce Indicator – https://in.tradingview.com/script/y07CPYwP-Bounce-Indicator-Black/
- Bounce Chart – https://in.tradingview.com/script/1KWKB5jt-Bounce-Chart/