Trend Analysis

The most basic backbone of the price action is trend analysis. A trend is a general direction where the scrip is/was heading. Trends in the stock market are classified into three types –
- Uptrend (Either it goes up.)
- Downtrend (Or, it goes down.)
- Sideways Trend (Or, it neither goes up/down reasonably enough to gauge a direction.)
Now the trend is time frame specific attribute. The same stock can be in an uptrend in a time frame and can be in a downtrend in another time frame.
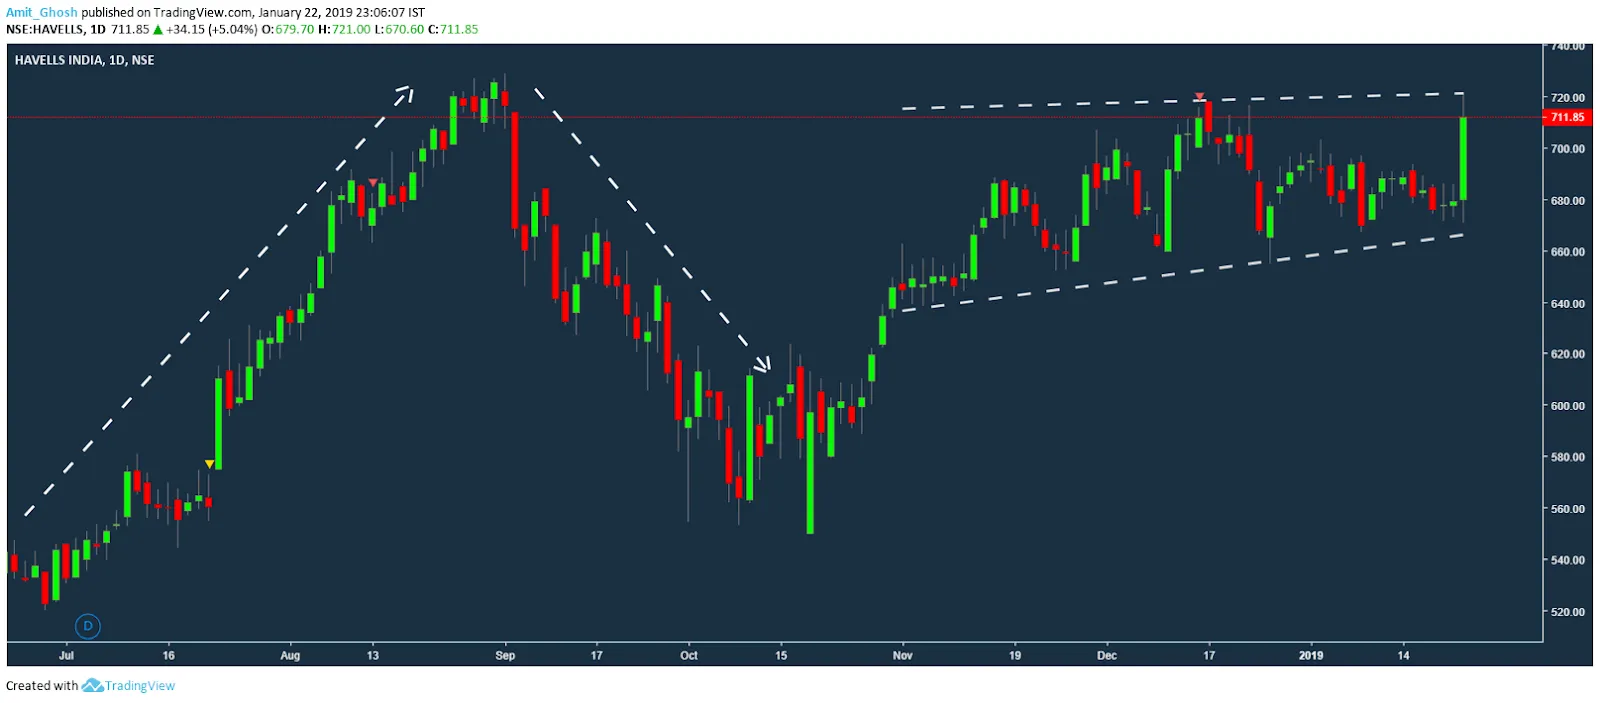 With Naked eye, one can clearly spot the Uptrend, Downtrend and Sideways trend in the daily frame of Havells as shared above. But to monetize it, one needs to have some proper set of rules on –
- How to define the trend.
- How to decide to bet on or against the direction of the trend.
- Where to enter the trade.
- How to exit the trade.
- How to maximize the profit and minimize the loss i.e. managing the trade.
Now there are many ways to define a trend. In some methods, different charting systems like Renko, Heikin–Ashi etc. and different indicators like moving average crossovers, MACD crossovers etc. are also used to define a trend.
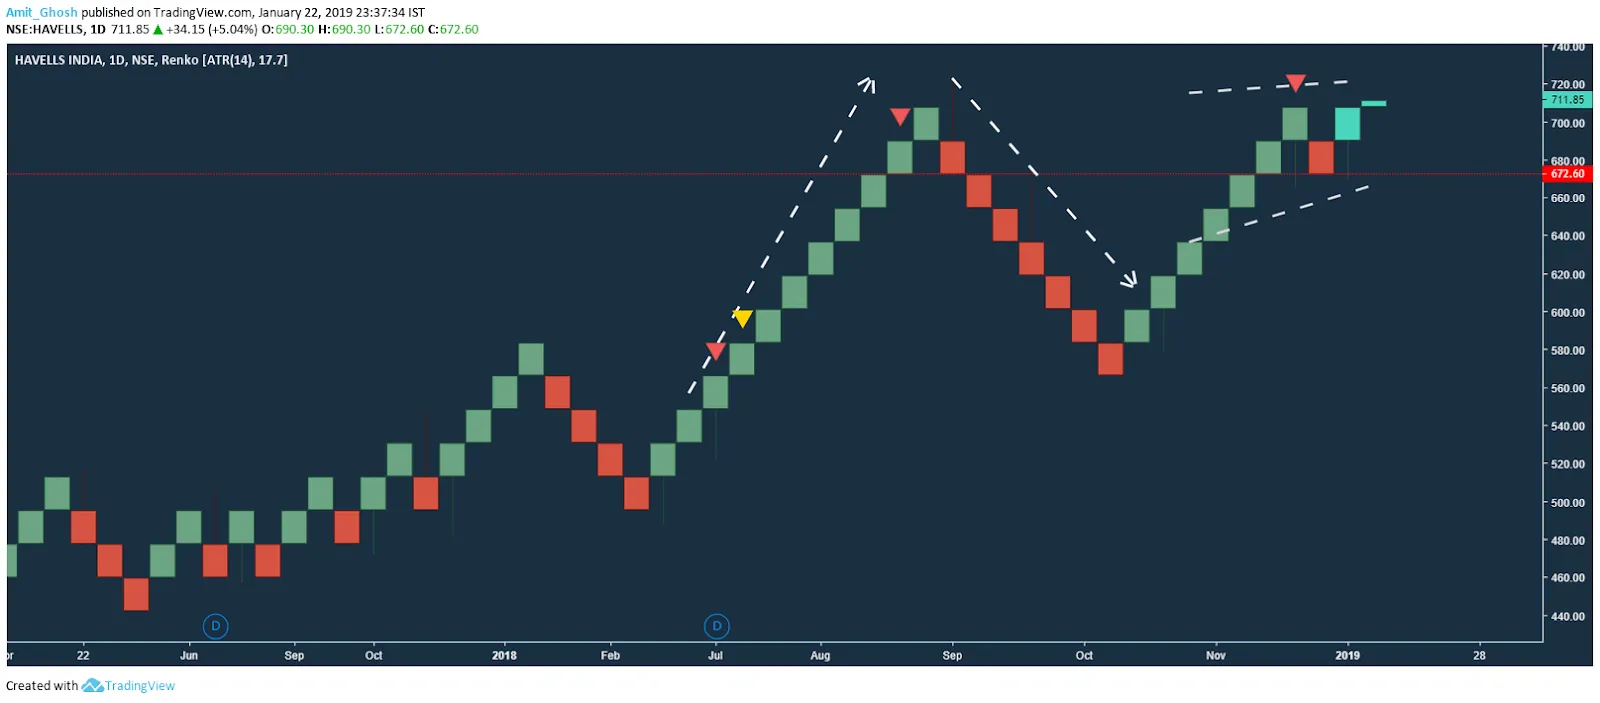 Here is an example of a Renco chart.
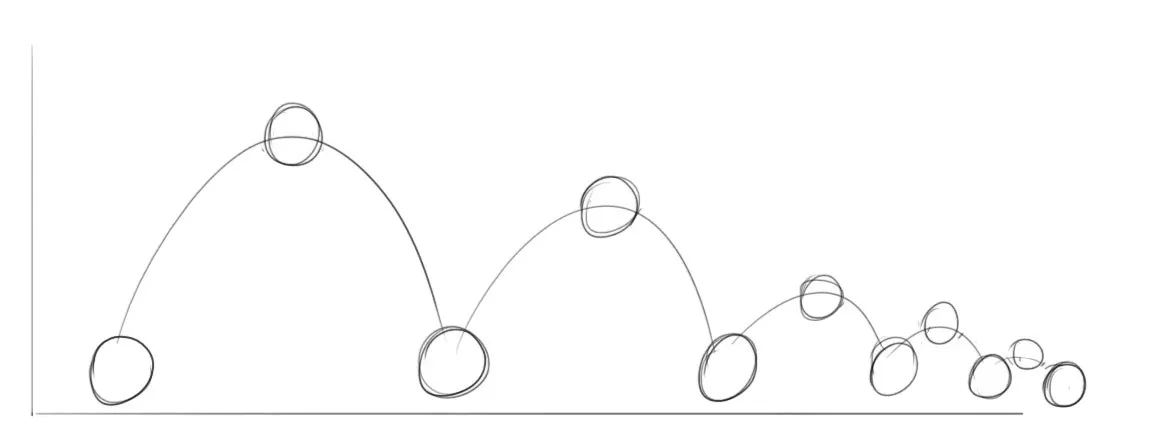 What we’re going to explore is normal candlesticks with no indicators and concept of swings to define a trend and to take decisions. In the example of a falling ball, we have discussed the bounce a falling ball makes before it falls even more.
What we didn’t discuss is – the ball can also bounce towards a higher level from where it fell if it is thrown at the ground with more force!
The whole concept of Swing Trading is more-a-like a ball bouncing where our task is to predict the direction and the momentum of the ball. Defining and Monetizing the trend with swings with proper risk management is called “Bounce Strategy”.
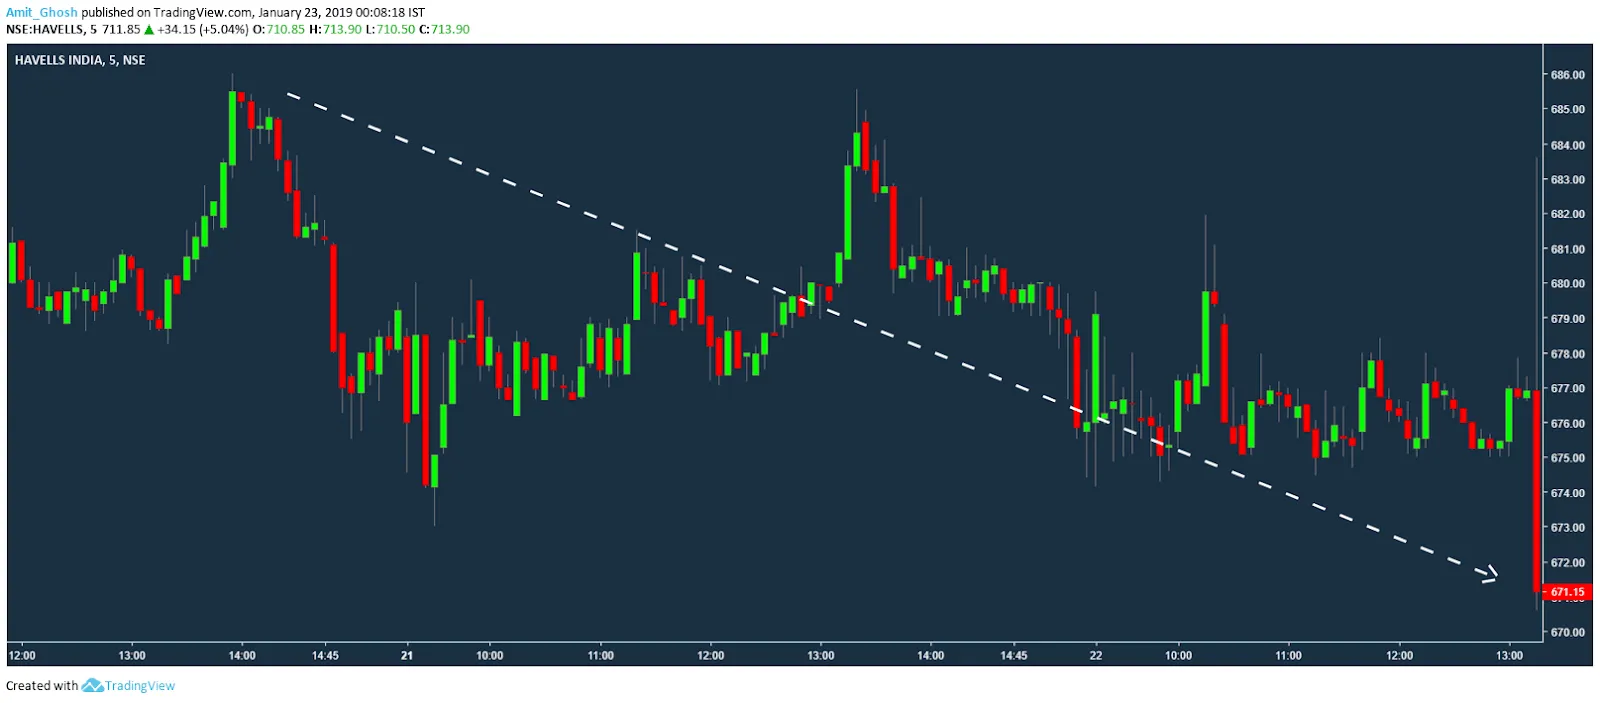
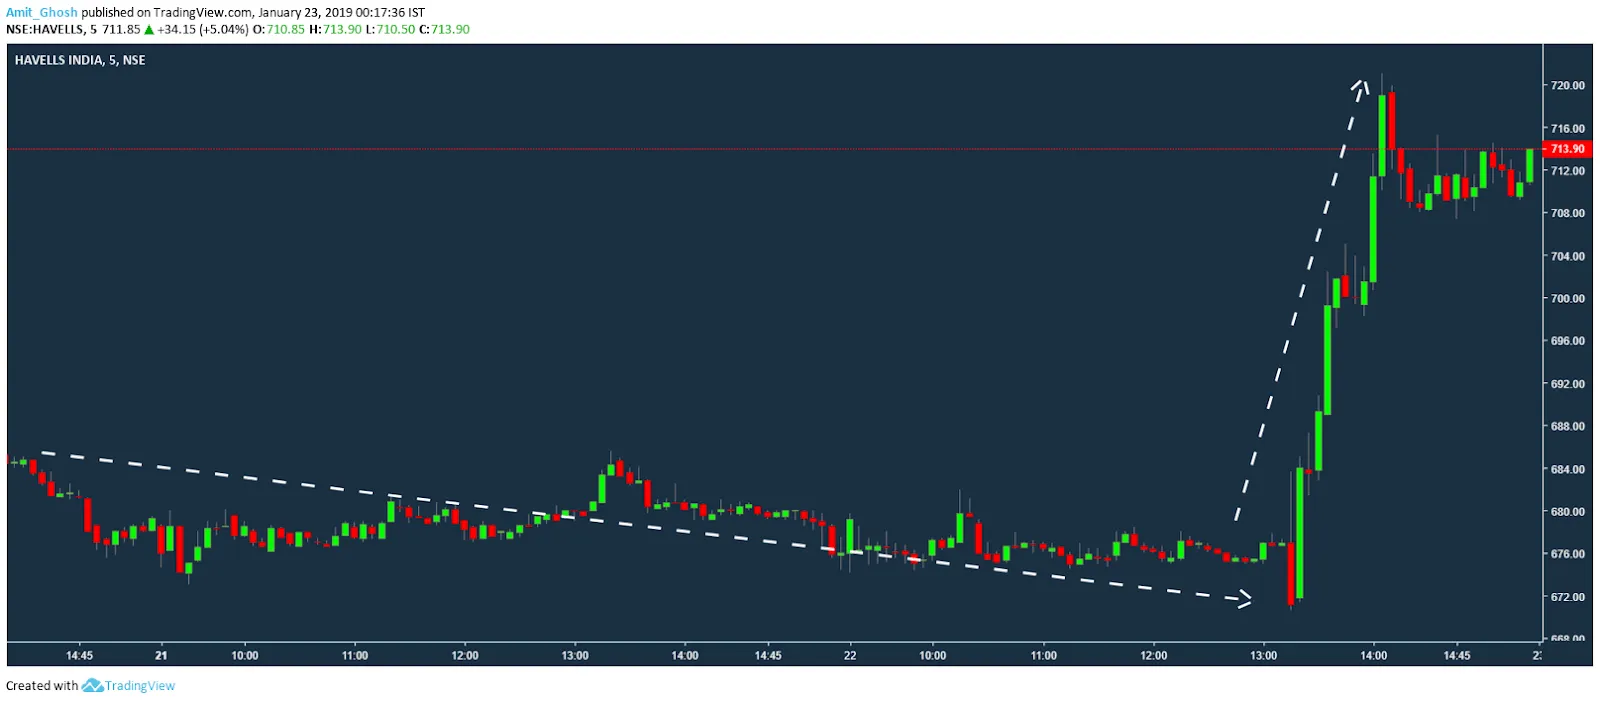
Here is an example from live trade to support our metaphor shared above! The shares of Havells were falling even before the results came and it did fall sharply the moment the results were declared.
One can easily spot it from the 5 mins time frame in the below image –
 But the results came good. In our metaphor, the ball was thrown with a strong force to the floor.
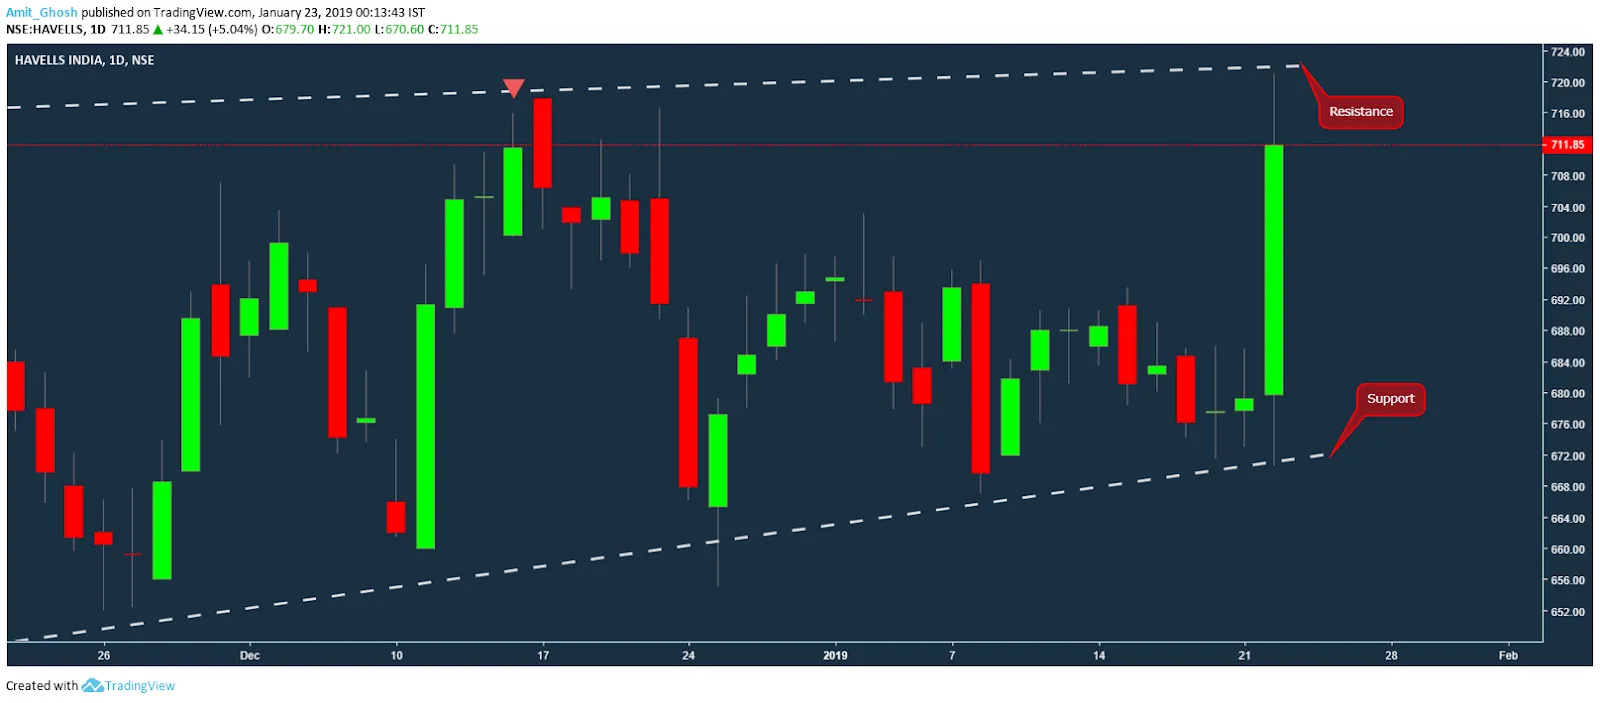
By floor, we are meaning the support i.e the lower boundary of the sideways trend (If a stock is moving sideways, it is supposed to have a higher range and a lower range.).
Here is what happened next –
 One can also see, that Havells has attained the upper boundary of the sideways trend and took a pause. What happens tomorrow will be interesting.
The breakout trader will bet that it is going to shoot up breaking the resistance. The mean reversion trader will bet that it will stay in the range and should fall down or at least, it will not break the resistance this time.
Before we discuss the correct textbook to deal with scenarios like this, We need to know about SAR (Stop And Reverse). If you sell a scrip with SAR it means there are two buy orders in the point of stop loss. Now, if stop loss is triggered, one buy order will close the sell trade. The other buy order will open a buy trade!
In this case of Havells, the bet one should bet in both direction by shorting with a SAR but one can also make a directional bet based on a few more things. Our discussion just tells that Havells is a trading opportunity with less risk high reward!
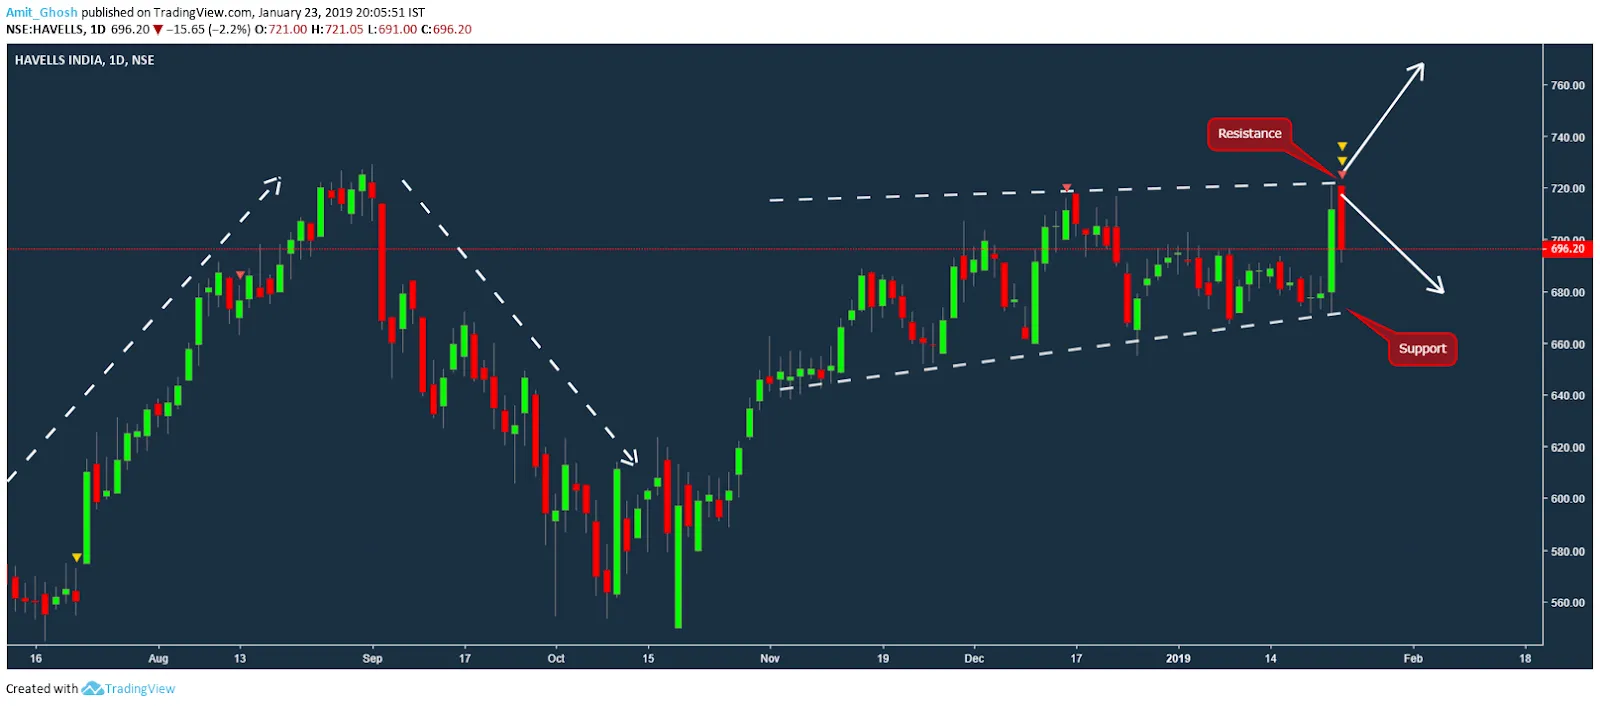
Havells fell respecting the resistance. If someone had shorted with a SAR, he is in profit right now. He can stay on the trade betting on more profit. But right now, the risk here is too high compared to the reward.