Timeframe
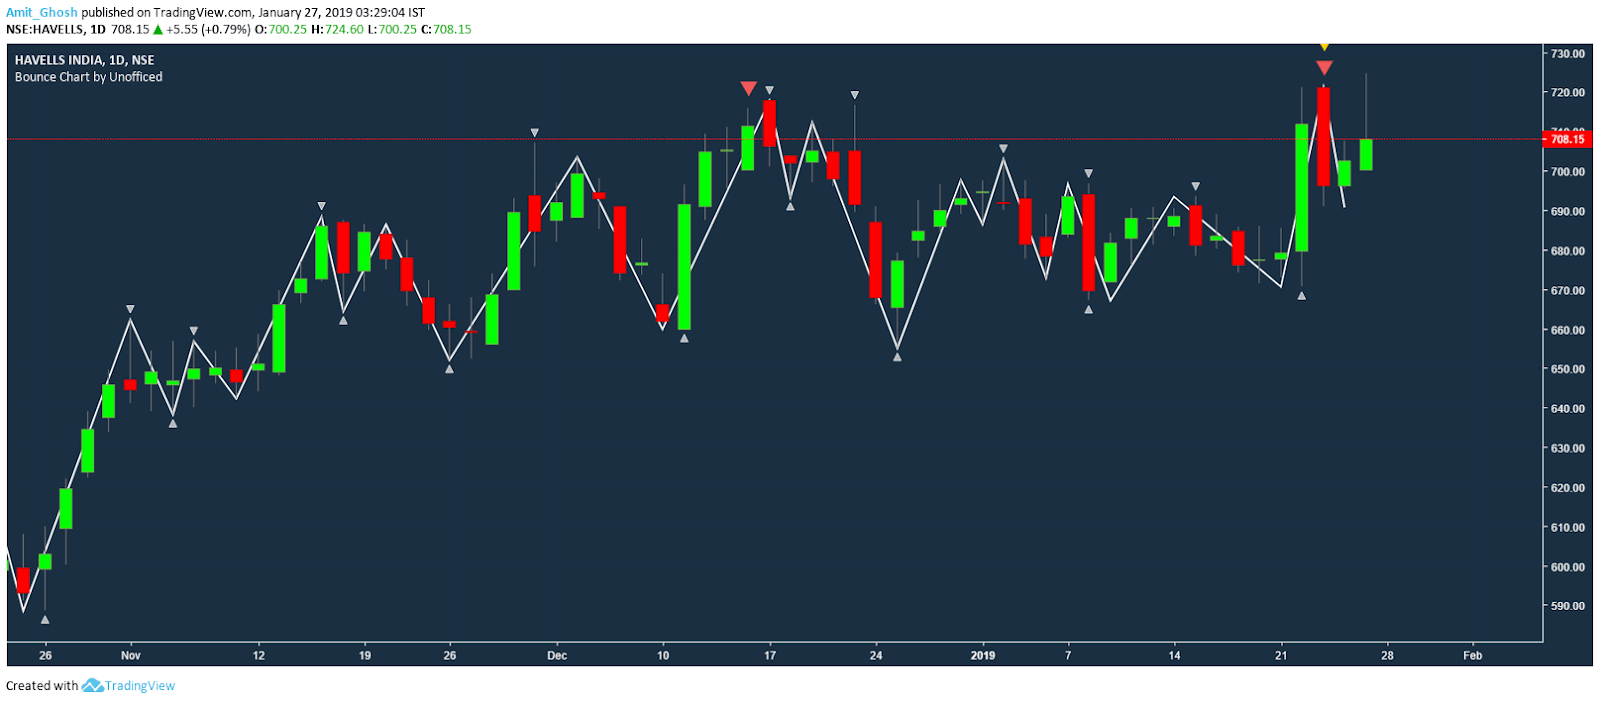
If we see the same scrip in a lower time frame, it looks like complete noise. This can be definitely labelled as a sideways trend even from naked eyes.
So, if a scrip is an uptrend in a higher time frame is not necessarily uptrend in a smaller time frame. The trend is completely time frame specific. Also while making a Higher Low; although it is in an uptrend; stock can be in a downtrend in a smaller time frame as it is moving to a Higher High to Higher Low point as a part of its journey!
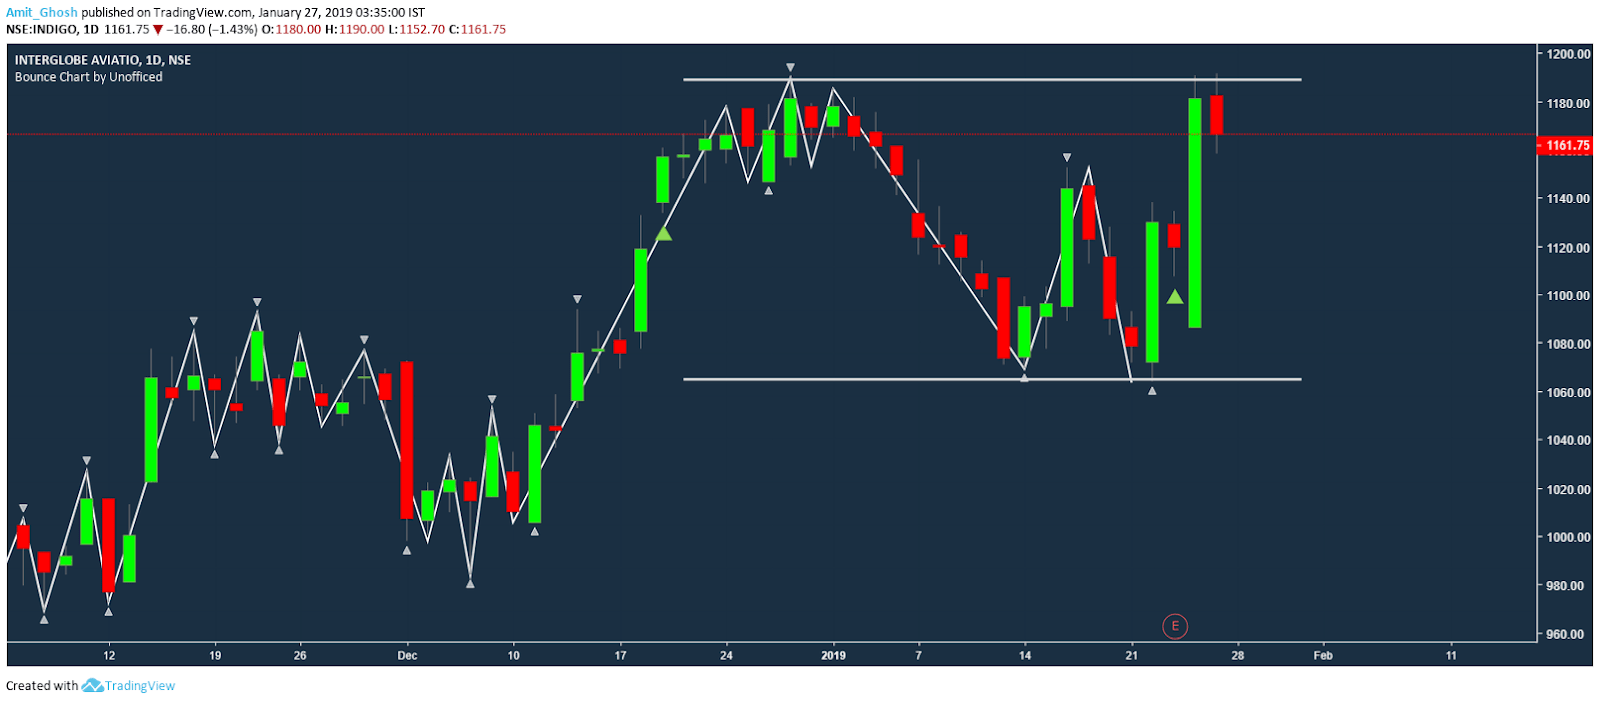
In the previous discussion of Indigo, although it triggered an uptrend in Weekly time frame. In the Daily time frame, it looks like retracing from the upper range of the sideways trend. This will trigger a short trade if the low of the previous day gets broken according to the chart of Daily time frame as shared here –
The main confusion with candlestick charts and price action lies with the concept of timeframe.
Now the choice of timeframe is based on the holding period of the strategy. If someone intends to just use daily time frame; his average trade will last several days or weeks but if someone intends to use lower time frames like 10 minutes, it will have more noise. So a scrip which is in an uptrend in one timeframe can be in different trend in other time frames.
In our above case, Indigo is a positional buy as per monthly time frame but it will be a good intraday short (or, a short trade for 2-3 days time period) if the low of the previous day is broken in the daily time frame!
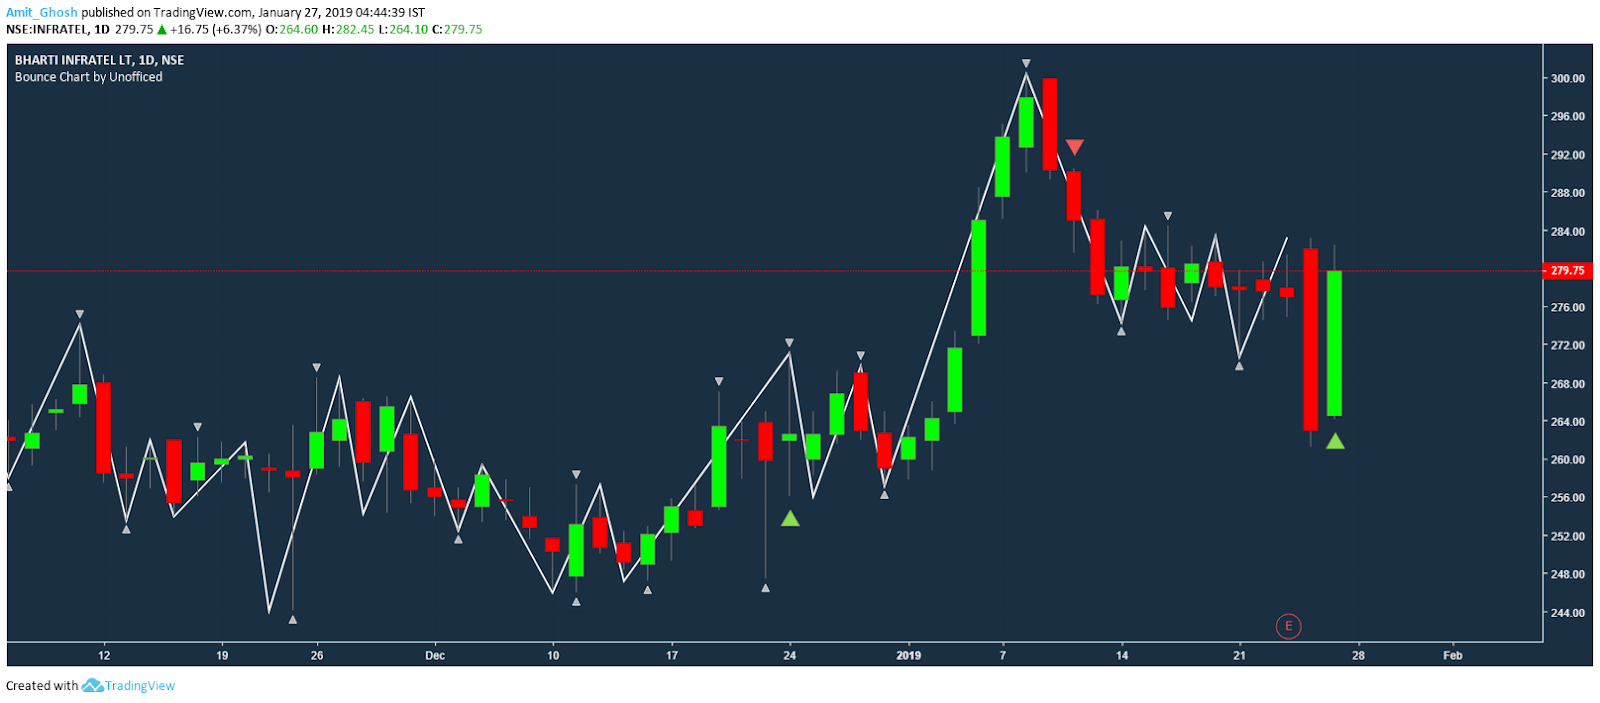
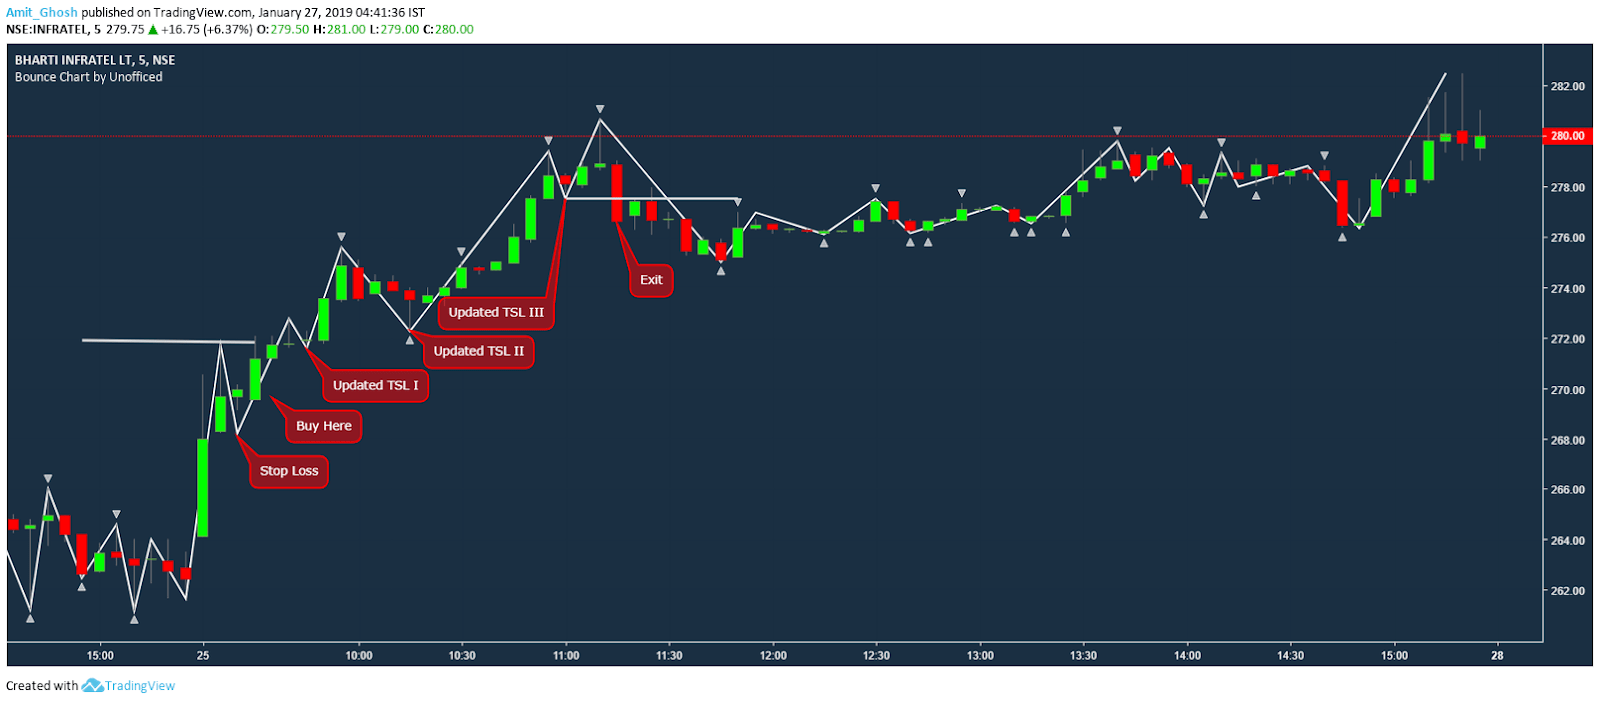 Here goes an example of Infratel in 5 minutes time frame which shows a perfect example of uptrend. But in the daily timeframe it looks like it is in a downtrend.
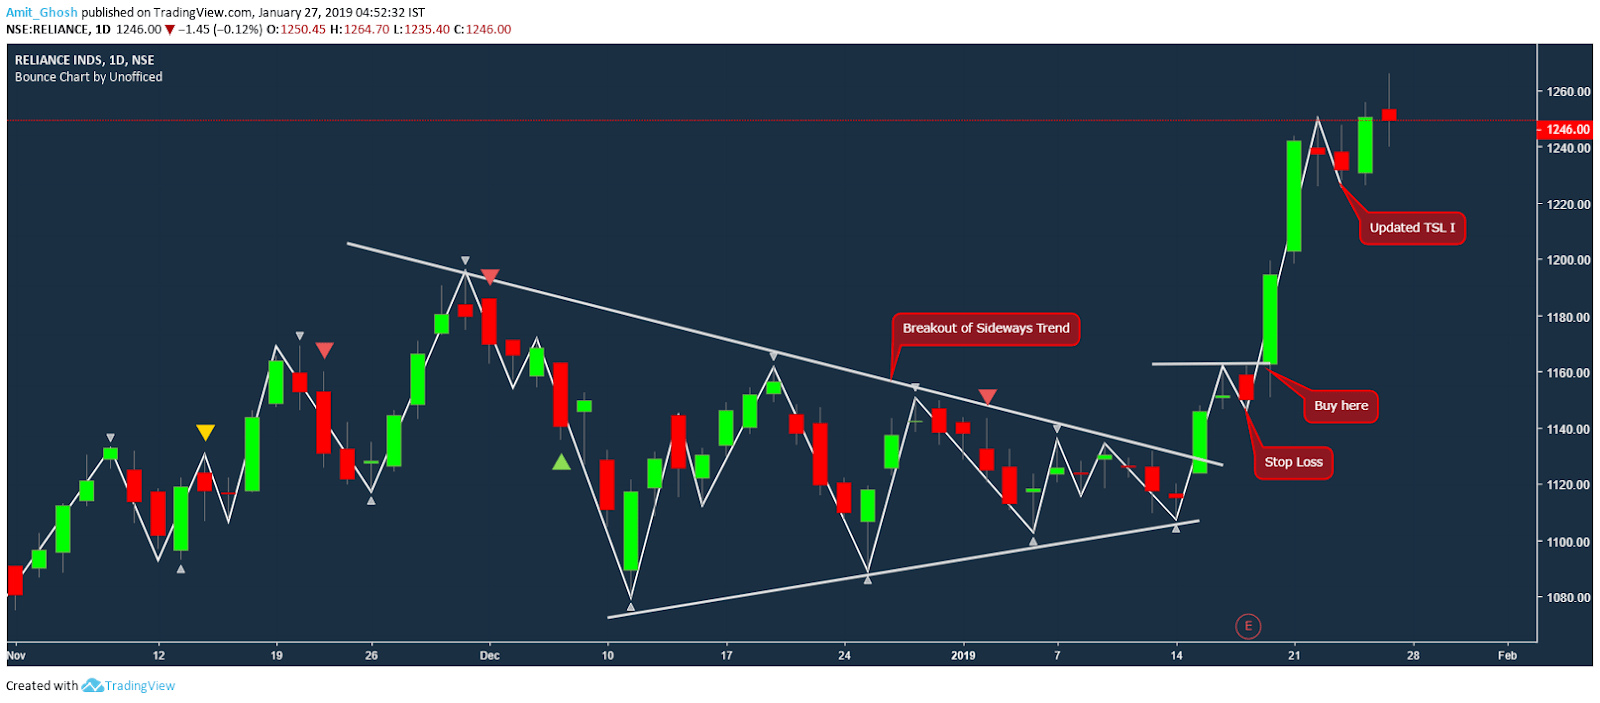
 Here goes a running trade of Reliance where it can be clearly seen how the sideways trend has been ended and Reliance did a nice uptrend followed by a breakout!
The whole concept of Swing Trading lies on the foundations of trend analysis; hence we should discuss on all kinds of aspects that create confusion!

