Making Payoff Graph of Options using Google Sheets

Refer – https://docs.google.com/spreadsheets/d/1Szh8y73NPDB1048VCZTeUUsqLRsIUIc0o6zvUm7T9HA/edit?usp=sharing
Suppose,
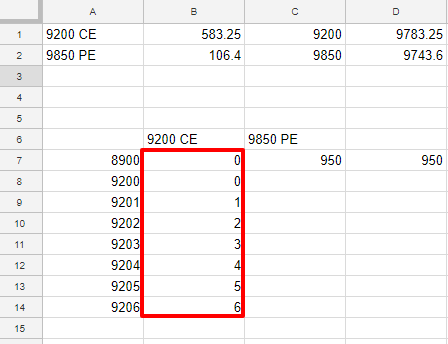
- NIFTY 9200 CE August is at 583.25
- Hence, breakeven point is 9200 + 583.25 = 9783.25
- NIFTY 9850 PE August is at 106.4
- Hence, breakeven point is 9850 – 106.4 = 9743.6
How to manually create breakevens and graphs in case of a combined scenario?
Option buying is limited loss and unlimited profit. So here is what the code is –
=if(A7>9201,A7-9200,0)
which means if “A7>9200” then “A7-9200” or “0”
If the value is greater than 9200 then result is value – 9200 or result is 0
- Hence in case of 8900, 8900>9200 is invalid; hence 0
- Hence in case of 8901, 8901>9200 is invalid; hence 0
- Hence in case of 9200, 9200>9200 is invalid; hence 0
- Hence in case of 9201, 9201>9200 is valid; hence 9201 – 9200 = 1
- Hence in case of 9202, 9202>9200 is valid; hence 9202 – 9200 = 2
and so on …
What should be the case of 9850 PE?
If the value is greater than 9850 then the result is 9850-value or result is 0
=if(A7<9850,9850-A7,0)
So our net profit is adding up those two columns –
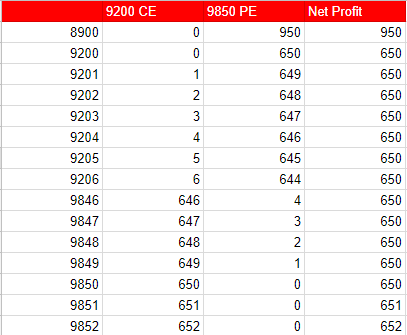
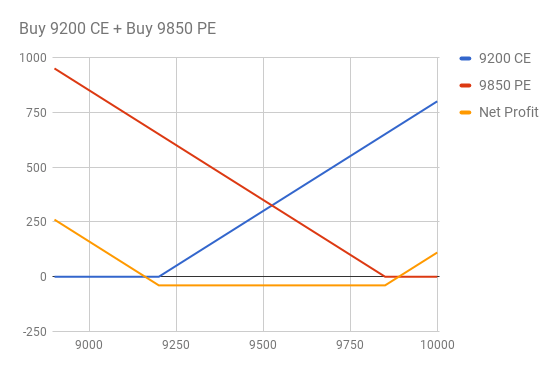
Now let’s do it for the whole range of 8900-10000. Keep an eye on Google Sheet. Actually it is not “net profit” but “the combined current value of 9200 CE buy and 9850 PE”.
To make a profit this “combined current value of 9200 CE buy and 9850 PE” must be more than our initial credit.
- NIFTY 9200 CE August is at 583.25
- NIFTY 9850 PE August is at 106.4
Combined Initial Credit = 582.25 + 106.4 = 688.65. Now, to make a profit our “combined current value of 9200 CE buy and 9850 PE” must be more than our initial credit which is 688.65.
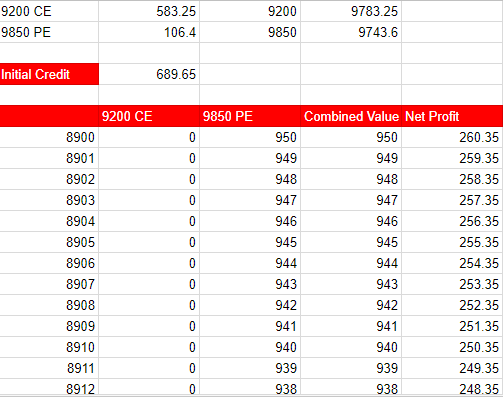
Net Profit is = Combined Value of (9200 CE + 9850 PE) – Initial Credit.
So, what is the breakeven point here? When our Net Profit is 0!
- In the case of a lower breakeven point, going below that point makes a profit.
- In the case of the upper breakeven point, going above that point makes a profit.
So in the case of breakeven points, 0 = Combined Value of (9200 CE + 9850 PE) – Initial Credit.
So, Combined Value of (9200 CE + 9850 PE) = Initial Credit.
So our breakeven points are –
- Upper Breakeven point = Upper Strike Price – IC = 9850 – 689.65 = 9160.35
- Lower Breakeven Point = Lower Strike Price + IC = 9200 + 689.65 = 9889.65
Q. In other words, 9200 CE we make profit if strike price > 9889.65; 9850 PE we make profit if strike price < 9160.35; Right?
A. NIFTY 9200 CE August is at 583.25 Hence, the breakeven point is 9200 + 583.25 = 9783.25 NIFTY 9850 PE August is at 106.4 Hence, breakeven point is 9850 – 106.4 = 9743.6 We are talking the case of the combined setup of (NIFTY 9200 CE August + NIFTY 9850 PE August). In that case we make profit if 9889.65 > CMP < 9160.35
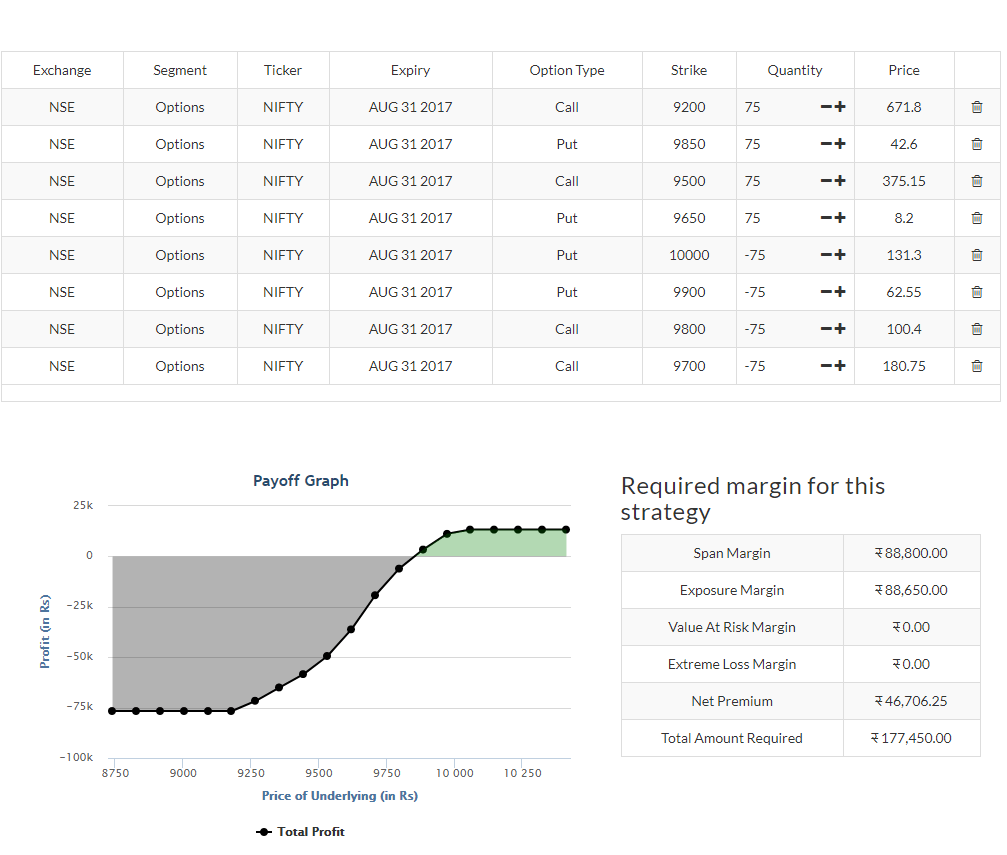
So here is our perfect payoff graph with the current CMP.
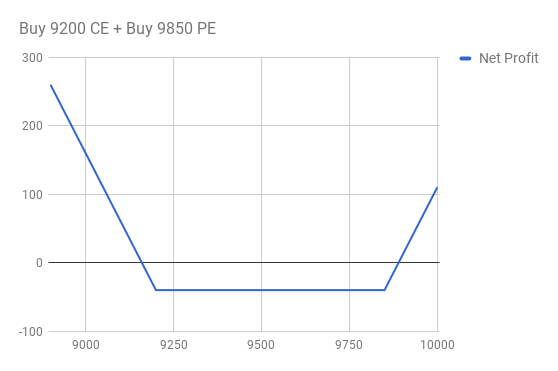
And this is our graph with just the net profit plotted –
Here are some cases –
- Breakeven Points Sell 9200CE + Sell 9850PE
https://docs.google.com/spreadsheets/d/1pAGkRIBsKYtilZNIO4mjGiX25RjVOf56IM2fWLa5K4A/edit?usp=sharing - Breakeven Points Sell 9200 CE + Buy 9850 PE
https://docs.google.com/spreadsheets/d/1sbBW0BBuawAv1ybWYJn5p64NadT2PeomDhdOkvIAtsU/edit?usp=sharing - Breakeven Points Sell 24500 CE + Sell 24200 PE
https://docs.google.com/spreadsheets/d/1aaXD3K7bK0TJdyV3UXFV7_EQSJemU6tzKkjRK_PgsrY/edit?usp=sharing
Net Profit
= Total of (Premium Received in Option Selling – CMP of the Option Sold) + Total of (CMP of the Option Buying – Premium Paid in Option Buying)
= Total of (Premium Received in Option Selling – Premium Paid in Option Buying) + Total of (CMP of the Option Buying – CMP of the Option Sold)
Let’ recap our old google sheet with this new idea of Net Profit. Here goes the new version –
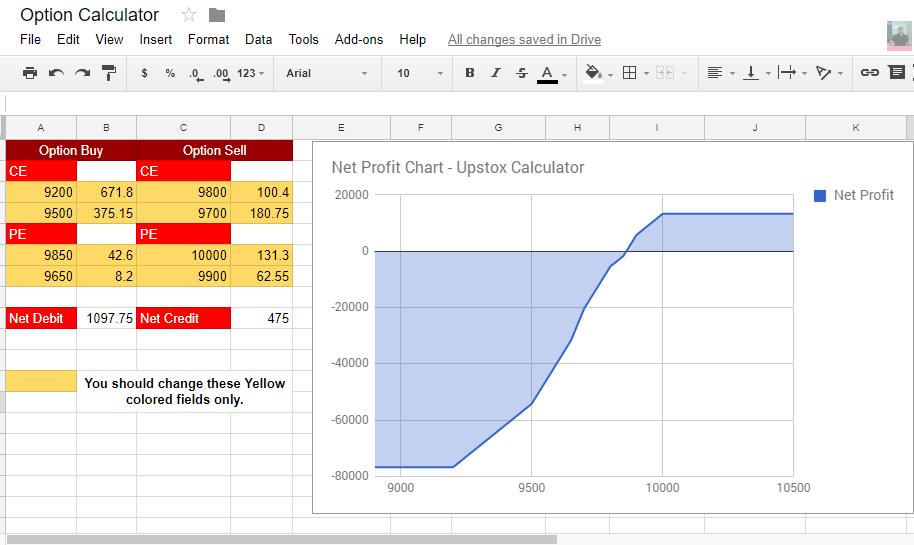
There are four types of calculations.
- Option CE Buy; Option CE Sell
- Option PE Buy; Option PE Sell
Limitation of the sheet is you can use a maximum of 2 Option CE/PE in Sell/Buy case. You can change the strike prices and change the prices. If you do not have anything to fill you can just delete that cell value to empty.
Currently, it is matching with Upstox Calculator here but we can not use Upstox Calculator in the middle of the day as it takes the previous day’s closing price on the go.