Understanding divergence
Parabolic SAR - Updated
MACD - Updated
An Algorithmic Approach to MACD Crossover Strategy

To begin with our MACD Crossover Strategy, let’s first understand the basics.
The pseudocode we will write is like a simple guide. It shows each step needed to make this strategy work in code form. First, we’ll list what we need to start, like the lengths of moving averages and our market data. Then, we’ll explain how to calculate the MACD and find buy or sell signals. Let’s get started!
Pseudocode
Initialize Variables:
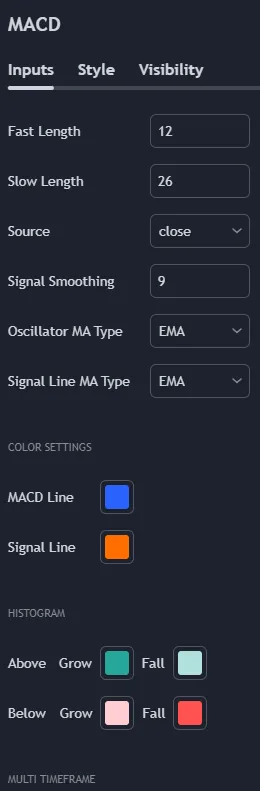
- fast_length: Length of the fast EMA (e.g., 12)
- slow_length: Length of the slow EMA (e.g., 26)
- signal_length: Length for signal line smoothing (e.g., 9)
- bars: List of price data (each item contains open, high, low, close)
Function calculate_ema:
- Input: prices (list), period (integer)
- Output: EMA values (list)
Function calculate_macd:
- Input: bars (list of dictionaries), fast_length, slow_length, signal_length
- Output: macd, signal, histogram (all lists)
Main Logic:
- Convert bars to a DataFrame
- Calculate fast EMA using calculate_ema function
- Calculate slow EMA using calculate_ema function
- Compute MACD as the difference between fast EMA and slow EMA
- Compute Signal line as the EMA of MACD with signal_length
- Calculate Histogram as the difference between MACD and Signal line
- Loop through the bars:
- For each bar:
- Determine crossover points:
- If MACD crosses above Signal line: Generate Buy Signal
- If MACD crosses below Signal line: Generate Sell Signal
# Note: In actual implementation, you would typically store these signals in a list or DataFrame for further analysis or action.
Python Code
					def calculate_ema(prices, period):
    return prices.ewm(span=period, adjust=False).mean()

def calculate_macd(bars, fast_length, slow_length, signal_length):
    close_prices = pd.Series([bar['close'] for bar in bars])
    fast_ma = calculate_ema(close_prices, fast_length)
    slow_ma = calculate_ema(close_prices, slow_length)
    macd = fast_ma - slow_ma
    signal = calculate_ema(macd, signal_length)
    histogram = macd - signal
    return macd, signal, histogram

def generate_macd_signals(bars, fast_length=12, slow_length=26, signal_length=9):
    macd, signal, _ = calculate_macd(bars, fast_length, slow_length, signal_length)
    signals = []

    for i in range(1, len(macd)):
        if macd[i] > signal[i] and macd[i - 1] <= signal[i - 1]:
            signals.append({'date': bars[i]['date'], 'signal': 'Buy'})
        elif macd[i] < signal[i] and macd[i - 1] >= signal[i - 1]:
            signals.append({'date': bars[i]['date'], 'signal': 'Sell'})

    return signals

# Example usage
bars = [
    {'date': '2023-01-01', 'open': 100, 'high': 105, 'low': 95, 'close': 102},
    {'date': '2023-01-02', 'open': 102, 'high': 110, 'low': 101, 'close': 108},
    # ... more data ...
]

signals = generate_macd_signals(bars)
print(signals)
Post a comment