How MACD is Calculated

The MACD line is constructed using two exponential moving averages (EMAs) of an asset’s price, and it’s designed to reveal changes in the strength, direction, momentum, and duration of a trend in the asset’s price.
Here’s a step-by-step breakdown of how the MACD line is constructed:
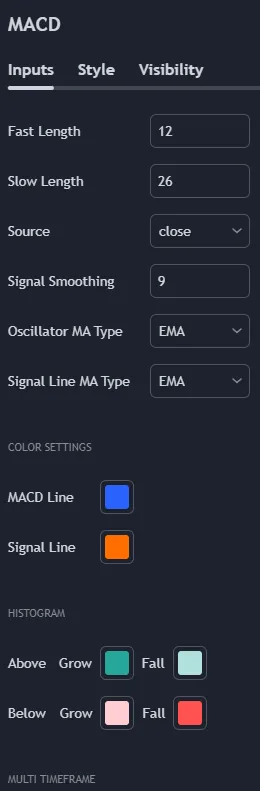
Step 1 - Calculate the Fast EMA (12-period EMA):
This is the first component of the MACD line. You calculate an exponential moving average using the last 12 periods of price data.
- An EMA is a type of moving average that places a greater weight and significance on the most recent data points.
- The “fast” in the name refers to the fact that it reacts more quickly to price changes than a longer-term moving average.
Step 2 - Calculate the Slow EMA (26-period EMA):
This is the second component and is calculated in the same way as the fast EMA, but it uses the last 26 periods of price data.
- Because it uses more data points, it’s slower to react to price changes than the fast EMA.
Step 3 - Construct the MACD Line:
- When the fast EMA is above the slow EMA, the MACD line will be positive, indicating upward momentum.
- Conversely, when the fast EMA is below the slow EMA, the MACD line will be negative, indicating downward momentum.
Signal Line (9-period EMA of the MACD Line):
Although MACD and the signal line were initially designed over EMAs, modern trading and charting platforms allow us to alter the settings to play with it. Their default setting of MA type is EMA.
Source:
This is the price data used to calculate the MACD. It can be the closing price, opening price, the high, the low, or an average of these. The most common source used is the closing price of each period.
In this case. The Source is “close” which means that the MACD is calculated using the closing prices of the asset for each period.
MACD Histogram:
MACD histogram does not have any settings that needs altering. Let’s redefine that by revisitng the concept –
While not a line, the histogram is an important part of the MACD indicator. It’s a visual representation of the difference between the MACD line and the signal line.
- If the MACD line is above the signal line, the histogram is positive (above the zero line).
- If the MACD line is below the signal line, the histogram is negative (below the zero line).
MACD Line and Trend:
In our last discussion, We saw the correlation between MACD histogram and the strength. Now, Lets revisit the same concept using MACD line.
In summary, the MACD line is created by taking the difference between a short-term EMA and a long-term EMA. The result is a line that moves around a zero baseline and can be used to identify momentum and potential trend changes based on its crossover with the signal line.
The closer the MACD line is to the zero line, the less momentum the current trend has. When the MACD line crosses above the signal line, it’s often seen as a bullish signal, and when it crosses below, it’s seen as bearish.
Although we are iterating same concepts, but on each iteration We are adding more information using context.