Hidden Divergence

In this chapter –
- You will learn what hidden divergence is,
- the different types of hidden divergence,
- how you can find hidden divergence,
- how you can trade with hidden divergence.
Normal divergence can provide insight into a potential market reversal ahead of time. Hidden divergence can provide insight into the potential trend continuation ahead of time.
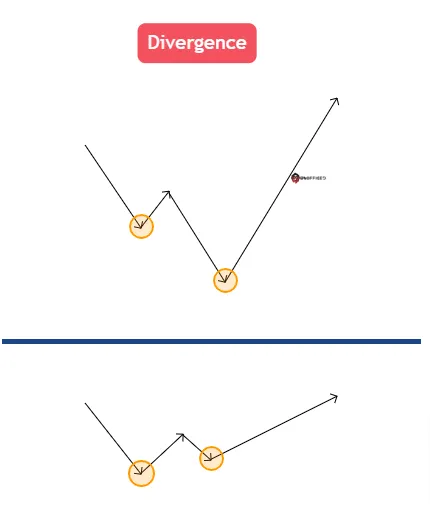
You are looking for divergence between price and the indicator, however, with hidden divergence you are looking for the opposite set of signals to normal divergence. Also, Hidden divergence operates similarly to standard divergence, as it also involves comparing the price action on the main chart with the movement of an indicator.
Identifying Hidden Divergence
To spot hidden divergence and predict the continuation of a trend, your first steps are to select an appropriate indicator and confirm that a trend is currently happening.
Like Standard Divergence, In this case also, the popular choices for this purpose include the stochastic indicator, the MACD, and the OsMA. However, nearly all indicators have the potential to reveal divergence. In this lesson, we’ll provide various examples using different indicators to demonstrate how hidden divergence can be identified in different market scenarios.
The two types of hidden divergence found are called –
- Bullish hidden divergence and
- Bearish hidden divergence.
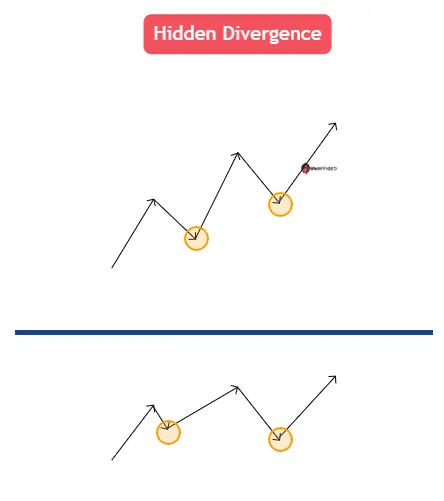
Bullish Hidden Divergence
When the price of an asset forms a series of higher lows, it usually indicates that an uptrend is occurring.
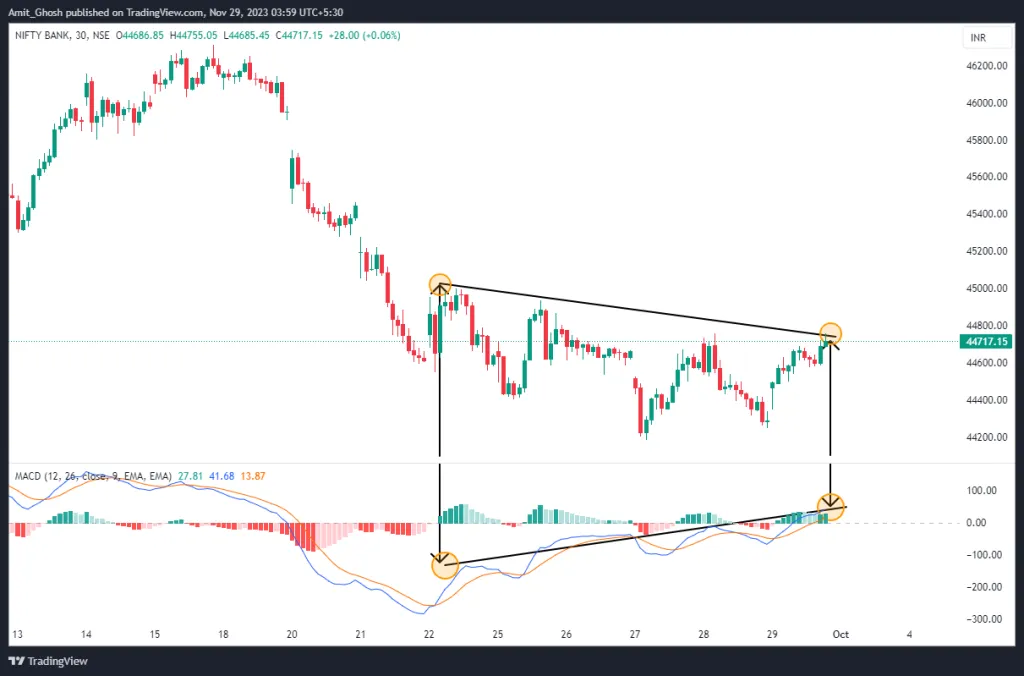
If you notice that the indicator, at the same time, is making a series of lower lows, this is a clear identification of hidden divergence. In this scenario, the hidden divergence suggests that the uptrend is likely to continue, offering a potential opportunity to go long, or buy, the asset.
The image below provides a visual representation of how this bullish hidden divergence is manifested on a chart. From the chart example we can see price making a series of higher lows denoting an uptrend. The indicator, however, is making a series of lower lows.
Here goes the aftermath ->
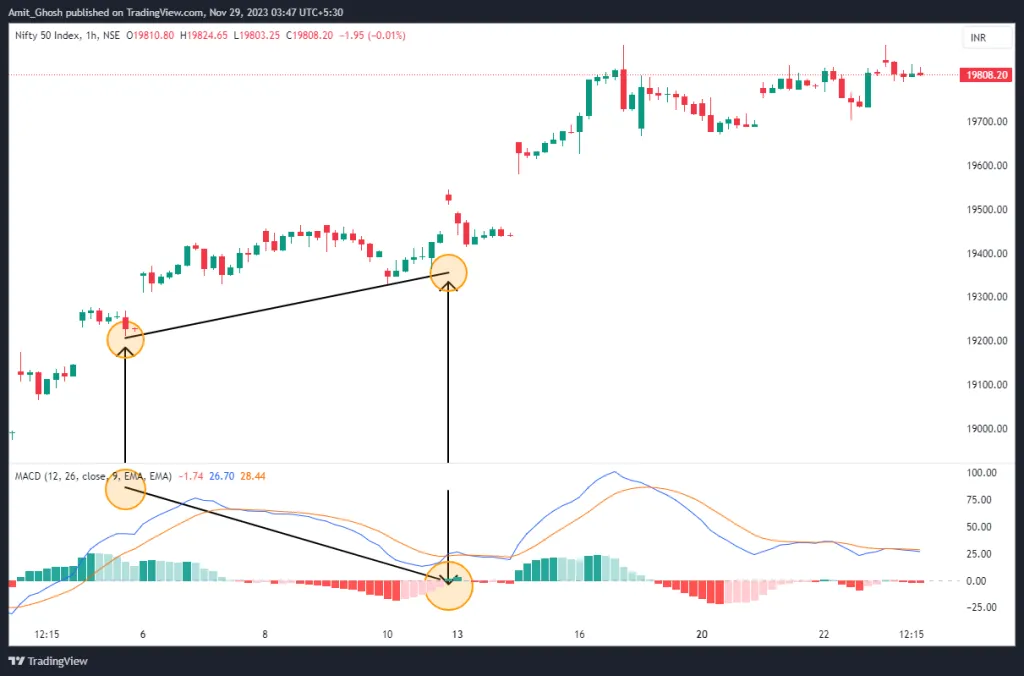
This is a trend continuation signal that normally precedes price moving in the same direction, potentially setting up a long trade. The easiest way to look for bullish hidden divergence is to first look for a market that is in an uptrend.
Bearish Hidden Divergence
When the price of an asset forms a sequence of lower highs, it typically signifies that a downtrend is in progress.
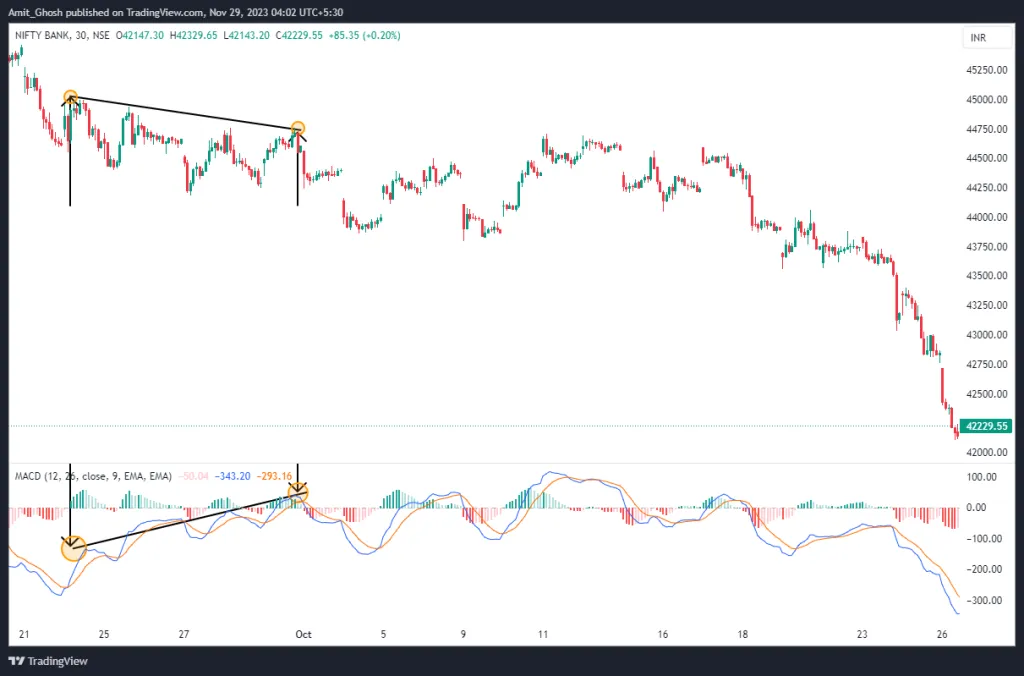
If, simultaneously, you observe that the indicator is making a series of higher highs, this is an instance of hidden divergence. This specific scenario indicates that the downtrend is likely to persist, presenting an opportunity to consider going short, or selling, the asset.
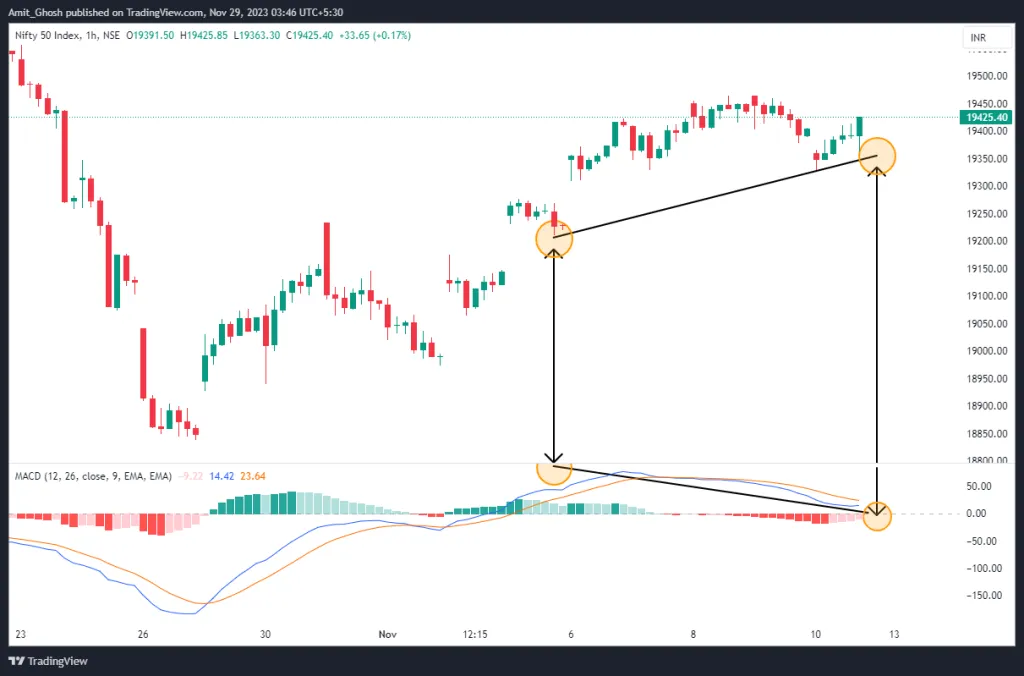
The image below illustrates an example of this bearish hidden divergence. We can see price making a series of lower highs denoting a downtrend. The indicator, however, is making a series of higher highs. There is hidden bearish divergence between the price and the indicator.
The market direction then continues with the downtrend.
It takes practice to spot hidden divergence.
It is recommended that if you are new to this concept you should concentrate on standard divergence first. Once you are used to finding standard divergence you can then incorporate hidden divergence into your trading at a later stage.
Key Points to Remember:
There are some key points to remember when trading hidden divergence.
- Longer Timeframes:
- The time period is relative. Hidden divergence is more effective with longer time frames.
- When you use a high time frame to search for hidden divergence, it might take a while for the trend continuation to happen. That’s why it’s generally better for longer periods.
- While hidden divergence can also be useful in shorter time frames, you should be cautious. Sometimes, by the time you spot the hidden divergence, the trend continuation might have already occurred and even finished.
- Multi-timeframe Analysis:
- Hidden divergence can be a useful tool for entering into a trend. Hidden divergence can be helpful in preparing to enter into a trend early on but it must be combined with a strategy defining the entry, stop loss and profit target.
- A way of using hidden divergence with a strategy for trading is to combine it with multiple time frame analysis.
- Trading with multiple time frame analysis can enhance the effectiveness of hidden divergence. For instance, you might use a higher time frame to spot hidden divergence, indicating a trend continuation. Then, switch to a lower time frame to pinpoint the best moment to enter the trade. This can give a trader a low risk trading opportunity to enter into the higher timeframe trend.
Conclusion
Once you’ve spotted hidden divergence you should also know what type of trade to look for.
- If price action is making higher lows but the indicator shows lower lows you are most likely seeing hidden bullish divergence. When this happens you should look for buying opportunities.
- If price action is showing lower highs but the indicator shows higher highs you are most likely seeing hidden bearish divergence.In this case you should look for selling opportunities.