Backtesting MACD Crossover Strategy in Tradingview

This script provides a solid foundation for backtesting the Positional MACD Crossover Strategy in TradingView. We have already discussed the strategy in the last chapter.
Backtesting NIFTY Futures
In Tradingview, You can find the NIFTY futures in a continous contact which means it will auto rollver when there is expiry and it will take the prive of the contact whcih is about to expire. So that is exaclty what we need.
So although the lot size and margin changes over time, we have taken the contract to be 1 which mean it will take the 1 lot automatically. The current margin of 1 lot nifty is around 1,50,000 inr. So, Lets run the strategy with various timeframe to analsyse how it is working.
The reason of choosing NIFTY straightforward because it is an index.
15 Minutes Timeframe
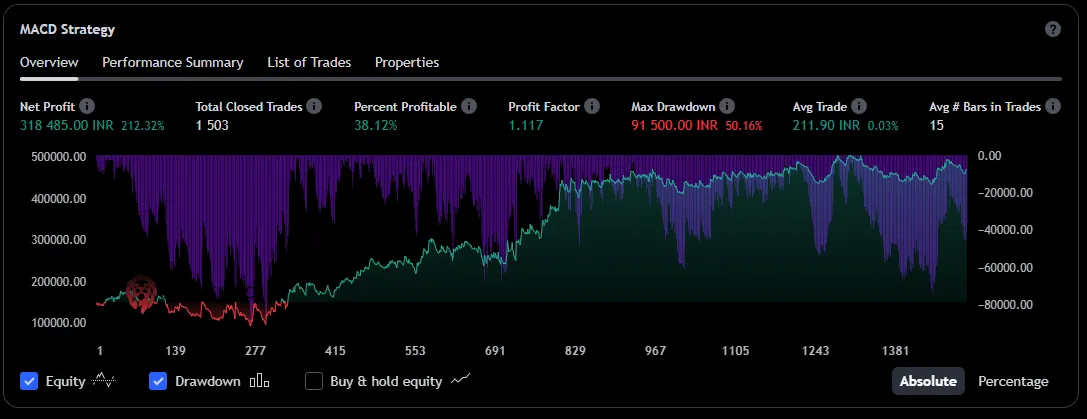
For the 15-minute timeframe, the strategy executed a total of 1503 trades, with a net profit of 318,485.00 INR and a profit factor of 1.117.
- The percent profitable was 38.12%, and the maximum drawdown was recorded at 91,500.00 INR, which is 50.16% of the strategy’s value.
- The average trade value was 211.90 INR, which is relatively low, indicating a strategy that takes advantage of small, frequent movements.
30 Minutes Timeframe
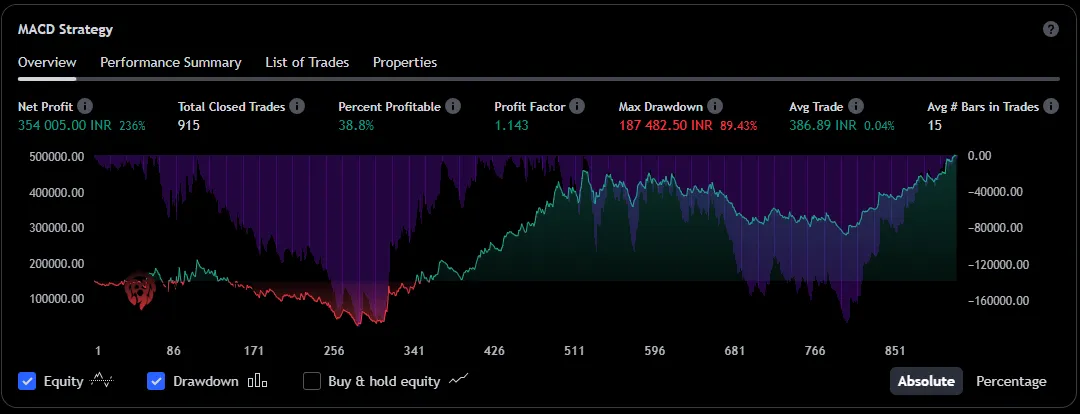
Moving to the 30-minute timeframe, there were 915 trades, a notable decrease, but with an increased net profit of 354,005.00 INR.
- The profit factor also rose slightly to 1.143, with 38.8% of trades being profitable.
- However, the maximum drawdown increased significantly to 187,482.50 INR (89.43%), suggesting higher volatility or risk in this timeframe.
1 Hour Timeframe
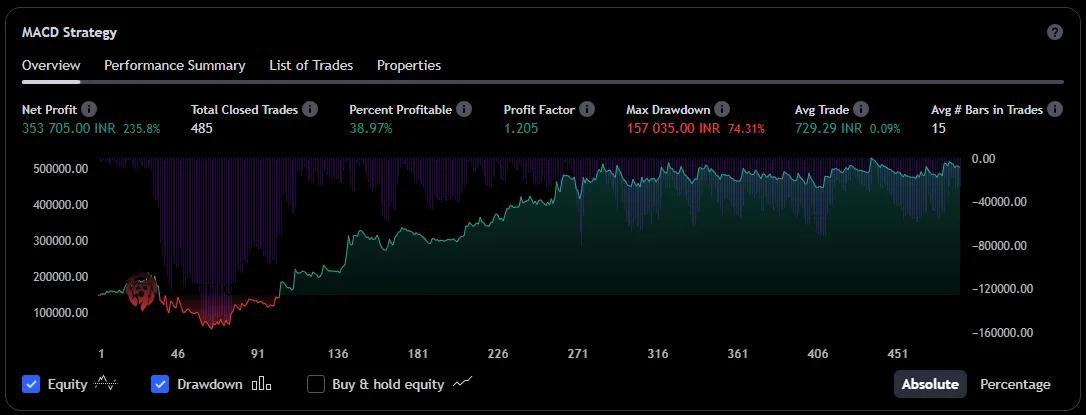
For the 1-hour timeframe, the number of trades fell further to 485, yet the net profit climbed to 353,705.00 INR, and the percent profitable trades stood at 38.97%.
- The profit factor here was slightly higher than the 30-minute timeframe at 1.205.
- Interestingly, the maximum drawdown decreased to 157,035.00 INR (74.31%), indicating better risk management over this timeframe.
1 Day Timeframe
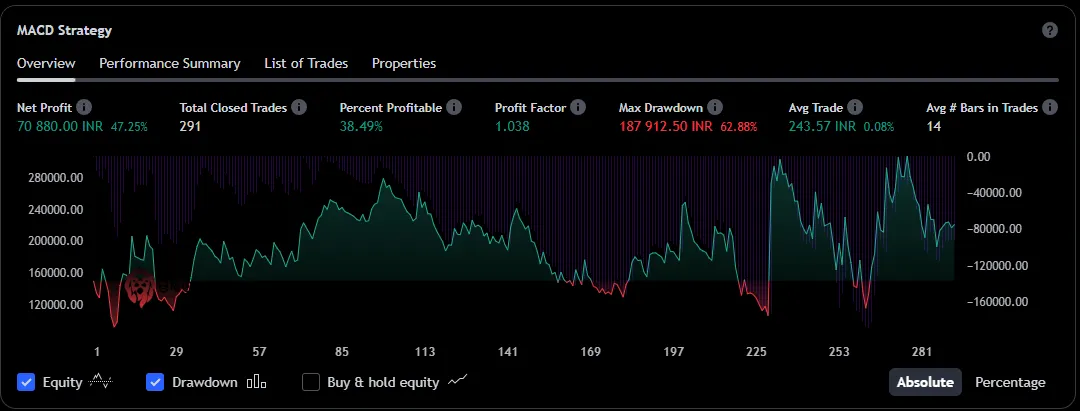
The 1-day timeframe backtest of the MACD crossover strategy on Nifty Futures shows that out of 291 total closed trades, the strategy produced a net profit of 70,880.00 INR, which is a 47.25% return on the initial amount.
- The strategy had a lower percentage of profitable trades at 38.49%, with the profit factor being slightly above the break-even point at 1.038, suggesting that the winning trades are just enough to cover the losses. The maximum drawdown, which is a measure of the largest peak-to-trough decline in the account’s value, was substantial at 187,912.50 INR (62.88%).
- This represents a significant risk as it indicates the potential for a large loss.
- The average trade was moderately positive at 243.57 INR, and the average number of bars in trades was 14, indicating that the trades are held for relatively short periods within the daily chart context.
1 Week Timeframe
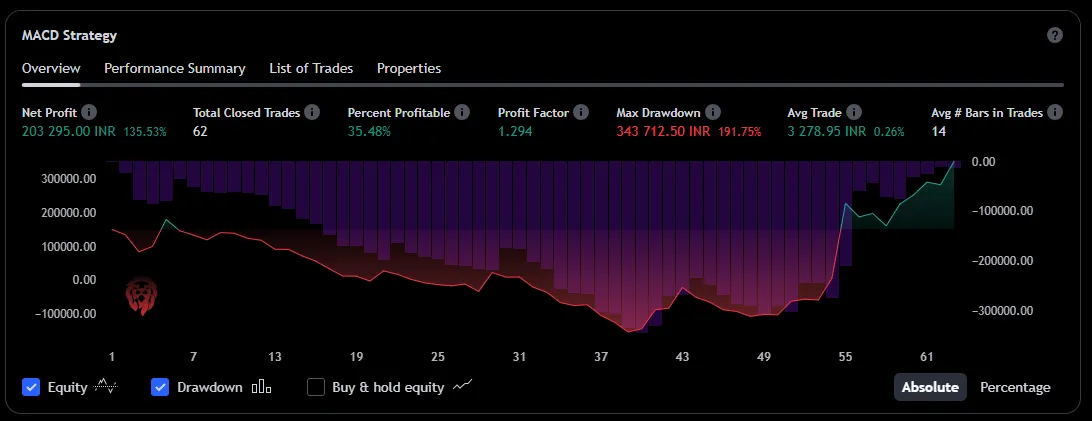
For the 1-week timeframe, the strategy executed 62 trades, yielding a net profit of 203,295.00 INR, which is a substantial 135.53% return.
- The percent profitable trades were 35.48%, which is the lowest among the timeframes discussed.
- However, the profit factor was relatively high at 1.294, indicating that the profitable trades were significantly larger than the losing ones.
- The maximum drawdown was quite large at 343,712.50 INR, representing 191.75% of the strategy’s peak value, which points to a high-risk profile.
- The average trade value was positive at 3,278.95 INR, suggesting that successful trades on a weekly basis tend to be quite lucrative, although they occur less frequently.
1 Month Timeframe
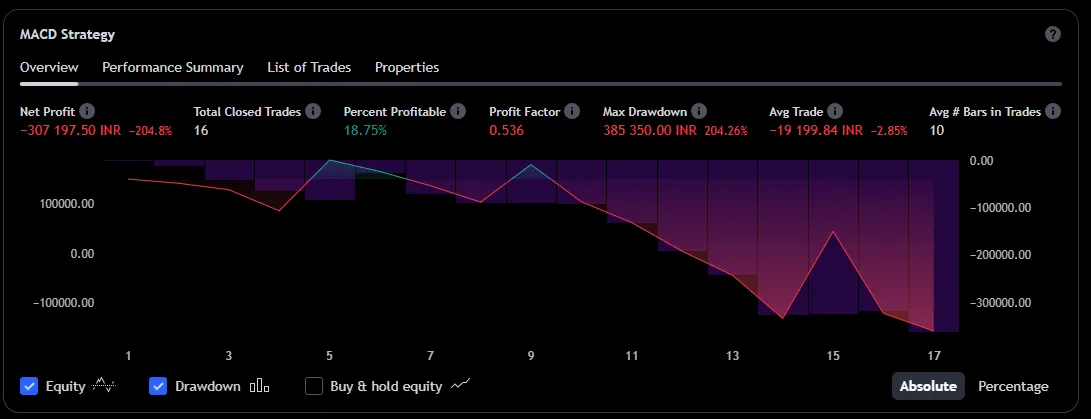
In the 1-month timeframe, the strategy executed just 16 trades.
- Despite the lowest number of trades, the net profit was deeply negative at -307,197.50 INR, with a profit factor below 1 (0.536), indicating that the losses are almost twice the size of the gains.
- The percent profitable was at a mere 18.75%, and the maximum drawdown was a substantial 385,350.00 INR (204.26%).
After closely examining the MACD crossover strategy applied to Nifty Futures over various timeframes, we observe a clear pattern in performance.
Starting with a 15-minute window, where trade frequency is high but profits per trade are smaller, we move to a 30-minute timeframe, which, despite fewer trades, shows improved net profits. As we expand our lens to an hourly scale, the trade count drops but profits remain consistent, with risk seeming more controlled.
The daily scale brings a balance, with fewer trades and moderate profits, though the risk, as indicated by the maximum drawdown, is still notable. Stepping up to a weekly view, we encounter a significant return rate with the trade-off of the lowest win rate and a high-risk profile.
Lastly, the monthly strategy presents a cautionary tale: with very few trades, it results in substantial losses, suggesting infrequency can be as much a bane as a boon.
In simple terms, the shorter 30-minute strategy seems to hit the sweet spot between managing risk and earning a profit, while the longer monthly timeframe, despite its high potential, carries too much risk due to its low number of trades.
As we see, the longer the timeframe, the more the strategy’s risk increases, which is something to keep in mind for those looking to dip their toes in trading waters.
So far, it is a blockbuster and simple strategy that works!
- Now, apart from NIFTY, What other instrument we can backtest with the MACD Crossoverbut Strategy?
- Also, Can it be automated directly in the account so that We do not have to stay glued into the screen?
- Why don’t you explore the strategy yourself with various instruments and various timeframes and share all the interesting results you get.