Divergence

In this chapter, you will learn –
- What divergence is,
- How you can find divergence, and
- the different types of divergence.
Divergence is a key concept that helps you anticipate a possible change in price direction ahead of time.
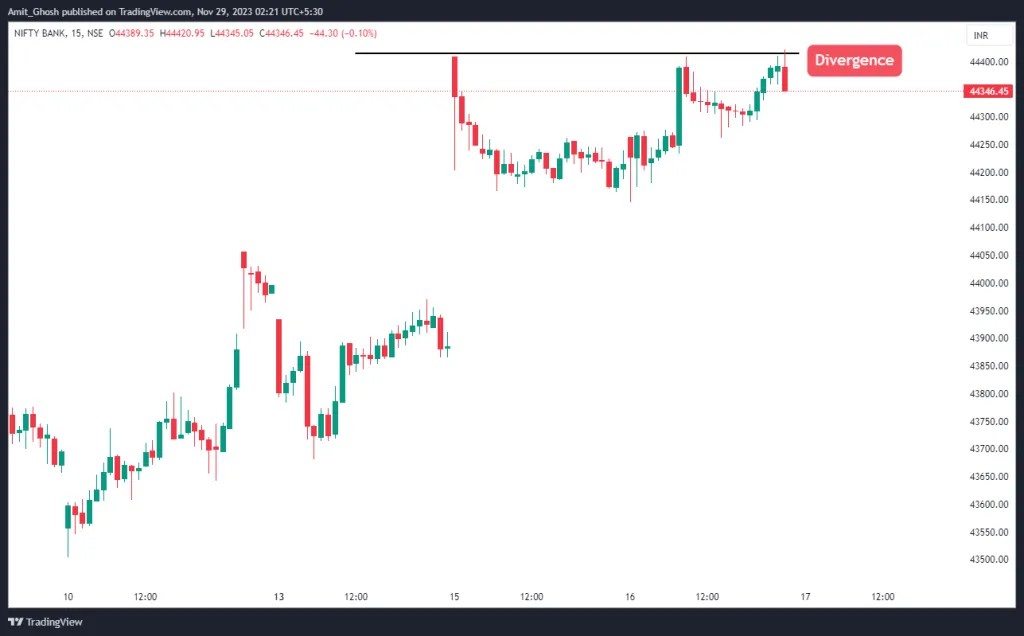
Here is aftermath –
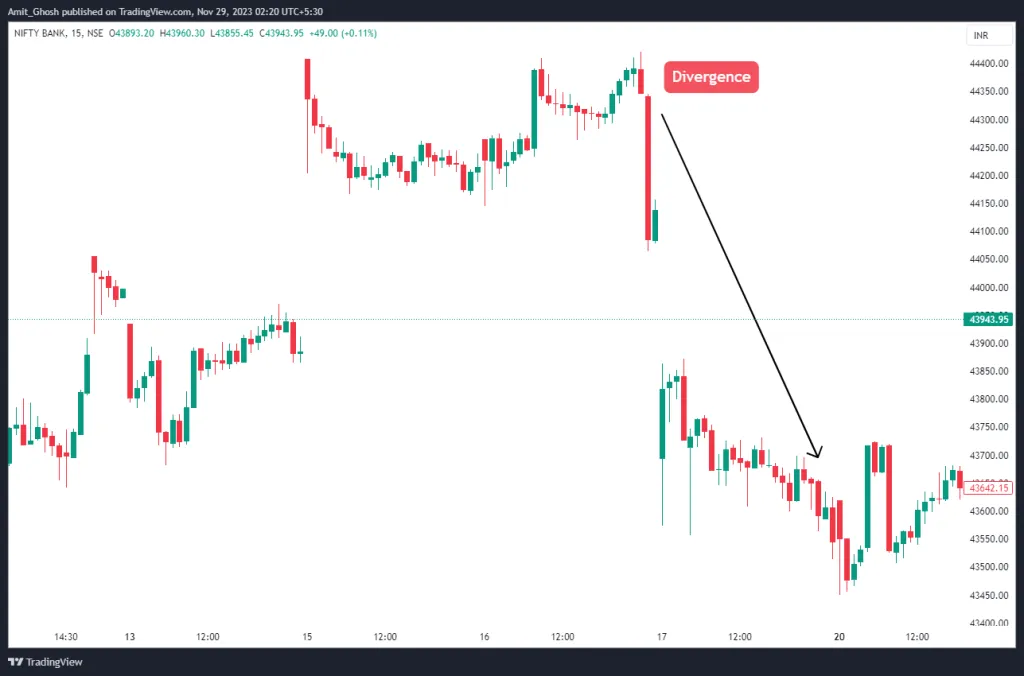
It alerts traders to a potential shift in market trends, suggesting a decrease in momentum and possibly presenting a chance to trade in a direction opposite to the current market movement.
When divergence is observed on a larger timeframe, it typically indicates a stronger likelihood of being a reliable signal compared to when it’s seen on a shorter timeframe.
What is divergence and how to spot it
Generally, an indicator will move in conjunction with the price as seen below. If price is making new lows, then the indicator will also make new lows.
Divergence occurs when there’s a mismatch between the indicator’s movement and the price action over a certain period. The exact duration of this period isn’t critical; it just needs to be sufficient to allow for a clear comparison.
The two most common types of divergence found are called –
- bullish divergence.
- bearish divergence.
Bullish Divergence
When price makes a new low but the indicator makes a higher low, it is called bullish divergence.
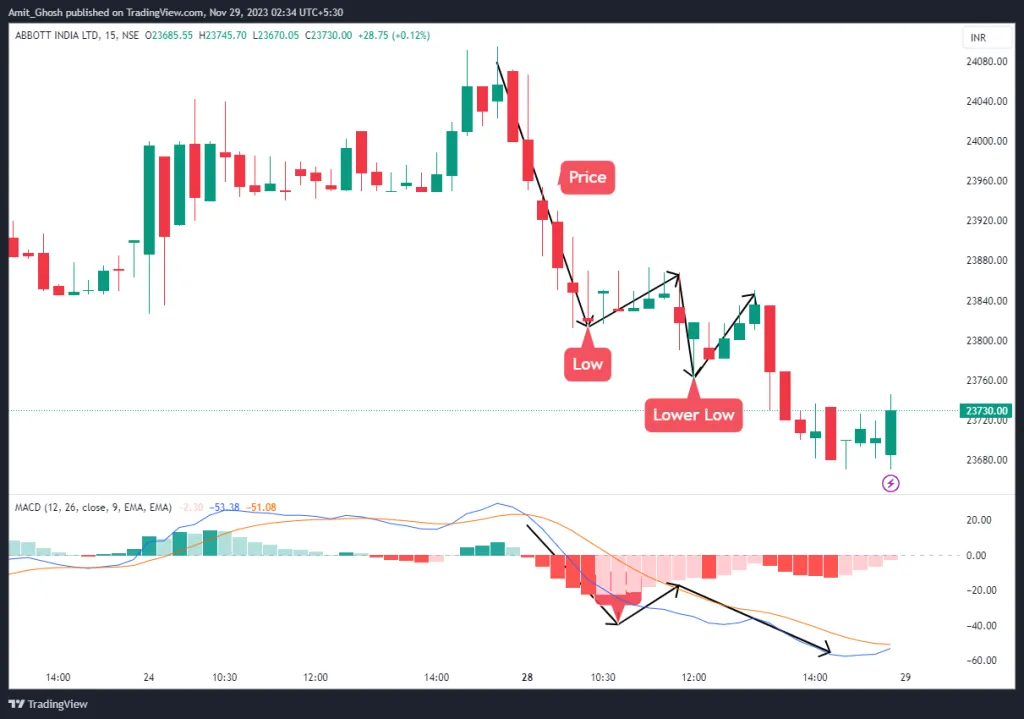
To identify a divergence, start by determining the market’s current trend. In the chart provided, you can see the price forming a pattern of lower lows and lower highs, indicating a downtrend. Contrastingly, the indicator isn’t following this pattern; instead, it has formed a higher low.
In this example, we will look at bullish divergence. The same stock Abbot India which does not has any divergence in 15 minutes timeframe as shown in the previous example is taken here but in a smaller time frame of 5 minutes.
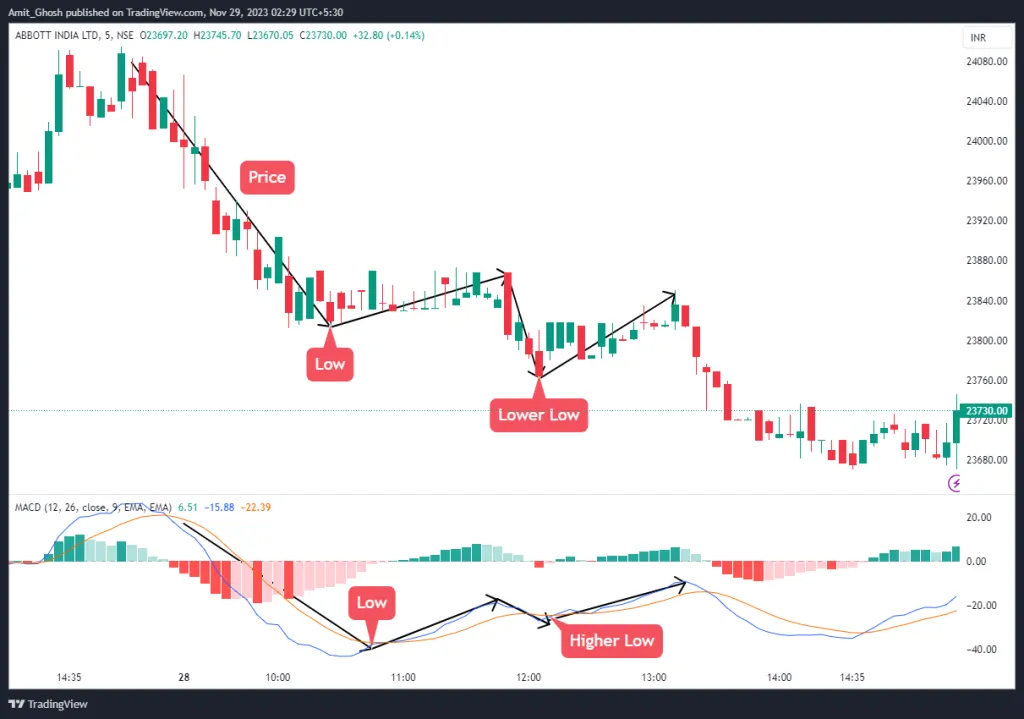
In the above example, You can see price makes a lower low, but the MACD indicator makes a higher low. This is an indication that we may see a move in the opposite direction.
Bearish Divergence
In this example, we will look at bearish divergence.
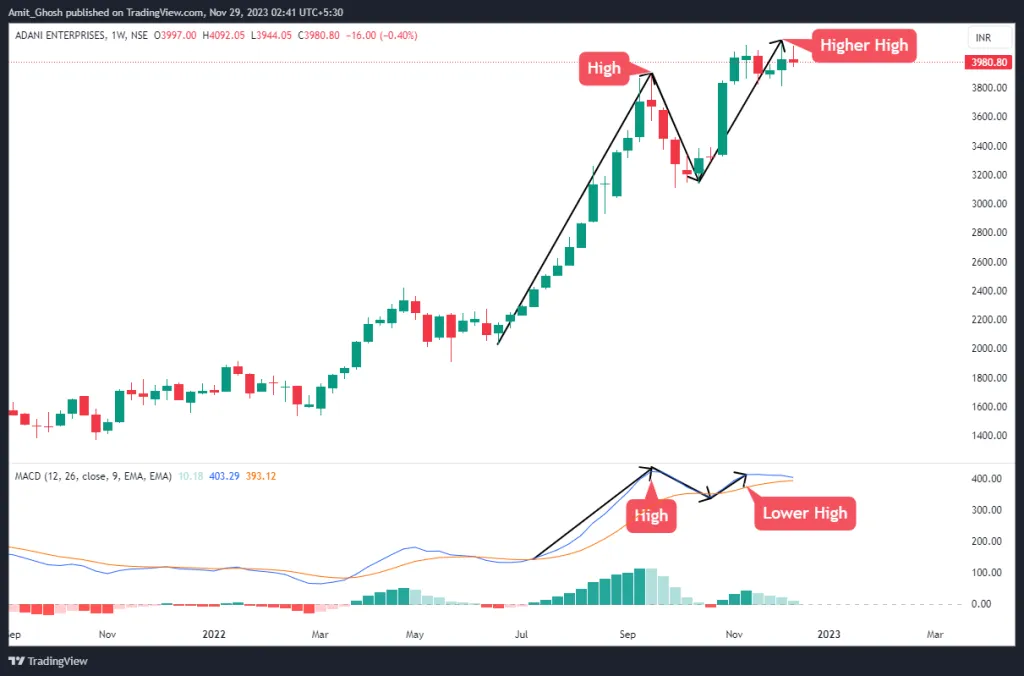
When price makes a new high but the indicator makes a lower high, it is called bearish divergence.
Observe that while the connection between the highs on the price chart form an upside angle, the connection between the highs on the indicator form a downside angle. This normally precedes price moving in the opposite direction, potentially setting up a short trade.
We will now look at what bearish divergence looks like on a chart. In this example of Adanient in Weekly timeframe, You can see price makes a higher high, but the MACD indicator makes a lower high.
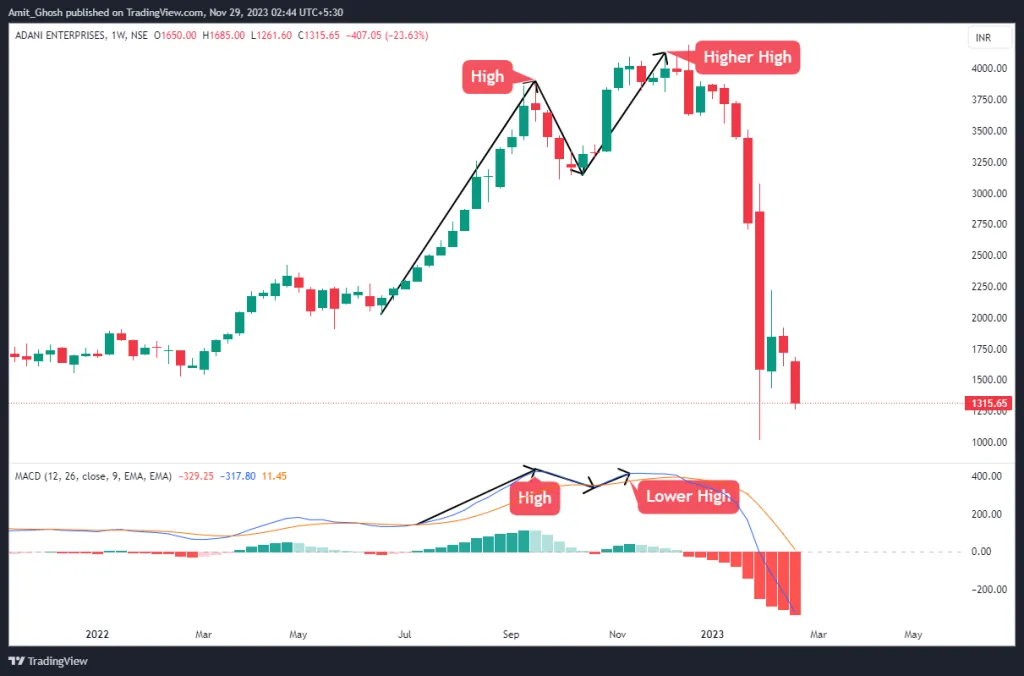
This is an indication that we may see a move in the opposite direction.
This is just before the infamous Heidelberg Report that led it to crash more than 50% of its value. But the chart indicates bearish divergence like an oracle. Here is the aftermath –
Key Concepts
- Multiple time frame analysis : Multiple time frame analysis can enhance divergence trading. By using a higher time frame to ascertain market direction, divergence can signal a potential shift in the overall trend. Subsequently, you can switch to a lower time frame to pinpoint a precise entry point, like a breakout from a trend line.
- Support and Resistance : Divergence near key support and resistance levels can be particularly significant. When divergence is spotted around these crucial points, it often signals a stronger potential for trend reversal or continuation. This convergence of divergence with support and resistance zones enhances the reliability of the trading signals, making it a valuable strategy for traders seeking to optimize entry and exit points in the market.
Conclusion
Spotting a divergence requires practice, but as you become more familiar with identifying them, they can serve as a valuable tool for anticipating potential changes in market trends.Common indicators like the stochastic, MACD, and OsMA are often used in trading. However, nearly any indicator can be employed to detect divergence.
So far you have learned that –
- Divergence can show a possible reversal in price action ahead of time, and it occurs when price moves out of sync with the indicator.
- Bullish divergence occurs when price makes lower lows and the indicator makes higher lows.
- Bearish divergence occurs when price makes higher highs, but the indicator makes lower highs.