Backtesting Triple Inside Bar Strategy Using Python

Prerequisite
In the last chapters,
- We have backtested the Double Inside Bar Intraday Strategy.
- We have also discussed Double Inside Bar Positional Strategy.
The only thing that needs changing in the code is the dataset because everythin g else exactly the same! So double_ib.csv will become triple_ib.csv which was shared in the earlier chapter. It contains all the FNO stocks that has exhibited Triple Inside Bar Pattern since 2015 to today.
					df = pd.read_csv("/root/apps/trident/double_ib.csv")
df
will become –
					df = pd.read_csv("/root/apps/trident/triple_ib.csv")
df
The output looks like –
					date	symbol	marketcapname	sector
0	08-12-2015	GNFC	Midcap	Industrials
1	16-12-2015	SHREECEM	Largecap	Industrials
2	23-12-2015	AMBUJACEM	Largecap	Industrials
3	17-02-2016	NESTLEIND	Largecap	FMCG
4	22-02-2016	MUTHOOTFIN	Largecap	Finance
...	...	...	...	...
172	20-06-2023	FEDERALBNK	Largecap	Bank
173	27-06-2023	NTPC	Largecap	Miscellaneous
174	02-08-2023	M&MFIN	Largecap	Finance
175	10-08-2023	SUNPHARMA	Largecap	Pharmaceuticals
176	21-08-2023	ZYDUSLIFE	Largecap	Pharmaceuticals
177 rows × 4 columns
It is exactly similar to the output of the dataset of other Inside bars. But the number of output is lowest i.e. 177! It is because Triple Inside Bar is the rarest of all.
Comparing the Performance Metrics with Index Inside Bar Intraday Strategy
As the entire codebase will be same, there is no need to re-invent the wheel. Therefore, let’s proceed to examine both strategies in parallel to gain a more insightful perspective.
Triple IB Intraday
					Net of buy_pl_points: 14538.290000000285
Net of sell_pl_points: 33741.169999999925
Positive buy_pl_points count: 25
Negative buy_pl_points count: 48
Total buy_pl_points count: 111
Positive sell_pl_points count: 38
Negative sell_pl_points count: 47
Total sell_pl_points count: 111
					Average of buy_pl_points: 130.97558558558816
Average of sell_pl_points: 303.97450450450384
Average of positive buy_pl_points: 12550.495200000014
Average of positive sell_pl_points: 9212.78184210526
Average of negative buy_pl_points: -6233.835208333335
Average of negative sell_pl_points: -6730.734893617021
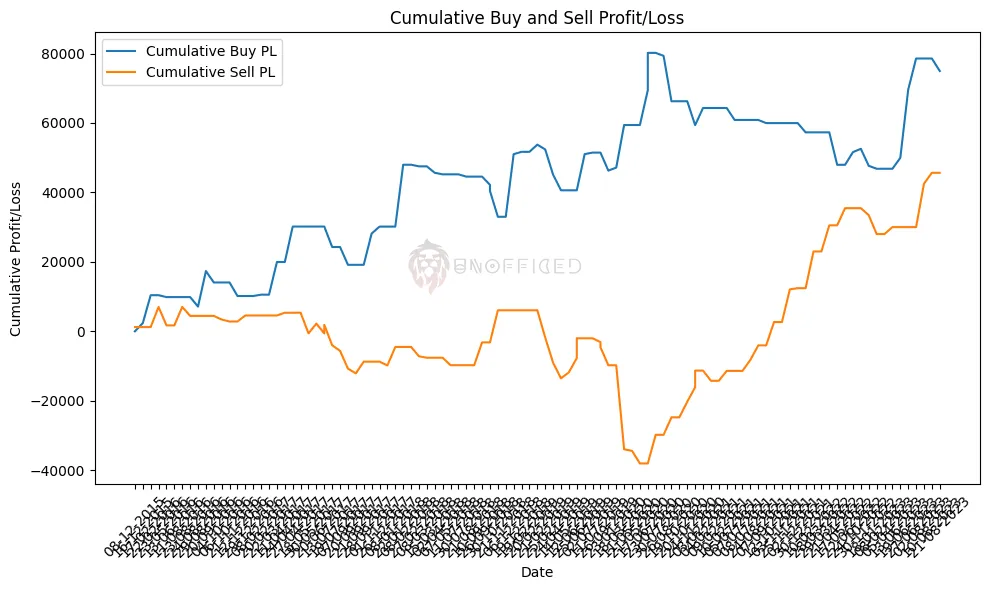
Triple IB Positional
					Net of buy_pl_points: 74966.53000000017
Net of sell_pl_points: 45652.83000000011
Positive buy_pl_points count: 24
Negative buy_pl_points count: 27
Total buy_pl_points count: 111
Positive sell_pl_points count: 32
Negative sell_pl_points count: 26
Total sell_pl_points count: 111
					Average of buy_pl_points: 675.3741441441457
Average of sell_pl_points: 411.28675675675777
Average of positive buy_pl_points: 7344.96125
Average of positive sell_pl_points: 4699.525312499999
Average of negative buy_pl_points: -3752.3162962962906
Average of negative sell_pl_points: -4028.1530769230712
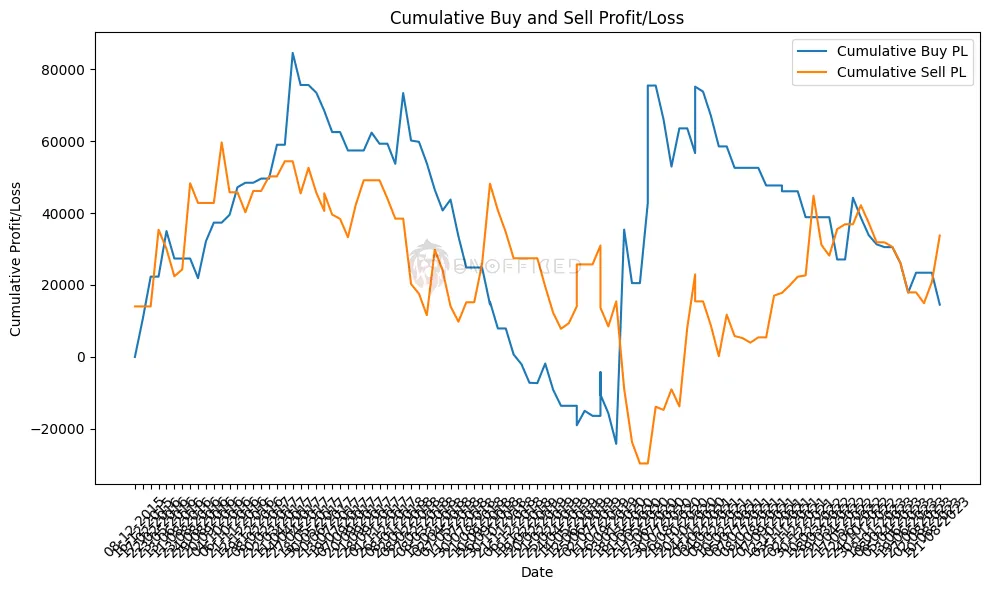
The key takeaway from this analysis is clear: the Triple Inside Bar strategy can be challenging when applying the same Inside Bar strategy to it. It tends to consolidate mostly at the starting point and often results in losses. This reinforces our decision to avoid Triple Inside Bar trades in the context of the Buddha strategy, highlighting the importance of data-driven analysis.
However the Backtested data analytics are available in detailed format in our website for lazy people –