Backtesting Index Inside Bar Positional Strategy Using Python

In the last chapter, We have backtested the Index Inside Bar Intraday Strategy. The only thing that will be different in the code for doing the Positional Strategy backtest is with the exit strategy.
So, We need to change the check_high_breakout_and_save function we designed in our earlier chapter.
to_date = from_date + datetime.timedelta(hours=5)
becomes –
to_date=from_date+ datetime.timedelta(days=5)
As already discussed earlier,
In case of Positional Trades,
The variable should be calculated adding 5 days. Although the strategy of Positional was initially developed for 7 days time frame but the returns do not vary much between 2 days and 7 days exit. As it is breakout/breakdown strategy, the ones that are consolidating hit its stoploss earlier. And, the ones those doesn’t, they move up or down significantly and keep consolidating in the new found zone.
The amount of profit is higher in Positional Trades but the number of loss trades is also higher balancing everything out. So, After doing lot of backtest, We settled on the number 5.
The amount of profit is higher in Positional Trades but the number of loss trades is also higher balancing everything out. So, the backtester Function for Positional Trade will look like –
					# Define the function to check high breakout and save entry time
def check_high_breakout_and_save(symbol, time,high,low,buy_target,sell_target):

    buy_trigger=0
    sell_trigger=0

    buy_trigger_stoploss=0
    sell_trigger_stoploss=0
    buy_trigger_target=0
    sell_trigger_target=0

    buy_exit_time=0
    buy_exit_price=0
    sell_exit_time=0
    sell_exit_price=0

    buy_pl_points=0
    sell_pl_points=0

    datetime_string = str(row['date']) + " 9:20:00+05:30"

    # Convert the datetime string to a datetime object
    from_date = datetime.datetime.strptime(datetime_string, '%d-%m-%Y %H:%M:%S%z')


    to_date = from_date + datetime.timedelta(days=5)

    data = kite.historical_data(instrument_token=get_insToken(symbol, "NSE"),
                                 from_date=from_date+ datetime.timedelta(days=1),
                                 to_date=to_date+ datetime.timedelta(days=1),
                                 interval='minute')

#     print(data)
#     sys.exit()
    for candle in data:
        if(buy_trigger==0):
            if candle['high'] > high:
                buy_trigger = candle['date'].strftime('%Y-%m-%d %H:%M:%S')
        if(buy_trigger!=0): #Buy Trade has Triggered

            if buy_trigger_target == 0 and buy_trigger_stoploss == 0:

                if candle['high'] > buy_target:
                    buy_trigger_target = candle['date'].strftime('%Y-%m-%d %H:%M:%S')
                    break

                if candle['low'] < low:
                    buy_trigger_stoploss = candle['date'].strftime('%Y-%m-%d %H:%M:%S')
                    break

    if buy_trigger != 0:
        if buy_trigger_target !=0:
            buy_pl_points=buy_target-high
        if buy_trigger_target ==0:
            if buy_trigger_stoploss !=0:
                buy_pl_points=low-high
            if buy_trigger_stoploss ==0:
                buy_exit_time = data[-1]['date'].strftime('%Y-%m-%d %H:%M:%S')
                buy_exit_price =  data[-1]['open']
                buy_pl_points=buy_exit_price-high


    for candle in data:
        if(sell_trigger==0):
            if candle['low'] < low:
                sell_trigger = candle['date'].strftime('%Y-%m-%d %H:%M:%S')
        if(sell_trigger!=0): #Sell Trade has Triggered

            if sell_trigger_target==0 and sell_trigger_stoploss==0:
                if candle['low'] < sell_target:
                    sell_trigger_target = candle['date'].strftime('%Y-%m-%d %H:%M:%S')
                    break

                if candle['high'] > high:
                    sell_trigger_stoploss = candle['date'].strftime('%Y-%m-%d %H:%M:%S')
                    break

    if sell_trigger != 0:
        if sell_trigger_target !=0:
            sell_pl_points=low-sell_target
        if sell_trigger_target ==0:
            if sell_trigger_stoploss !=0:
                sell_pl_points=low-high
            if sell_trigger_stoploss ==0:
                sell_exit_time = data[-1]['date'].strftime('%Y-%m-%d %H:%M:%S')
                sell_exit_price =  data[-1]['open']
                sell_pl_points=low-sell_exit_price

    return buy_trigger,sell_trigger,buy_trigger_stoploss,sell_trigger_stoploss,buy_exit_time,buy_exit_price,sell_exit_time,sell_exit_price,buy_trigger_target,sell_trigger_target,buy_pl_points,sell_pl_points
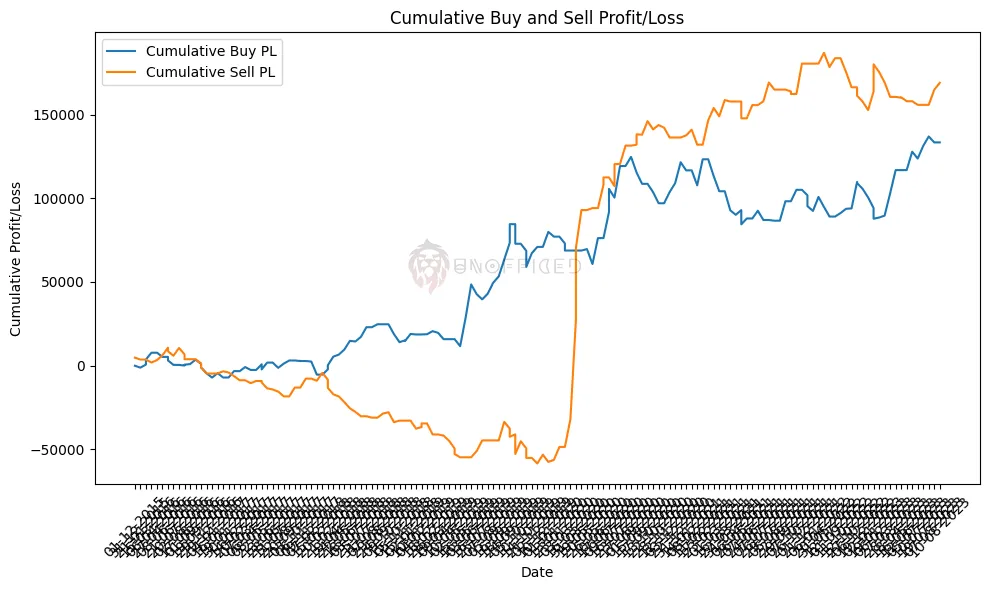
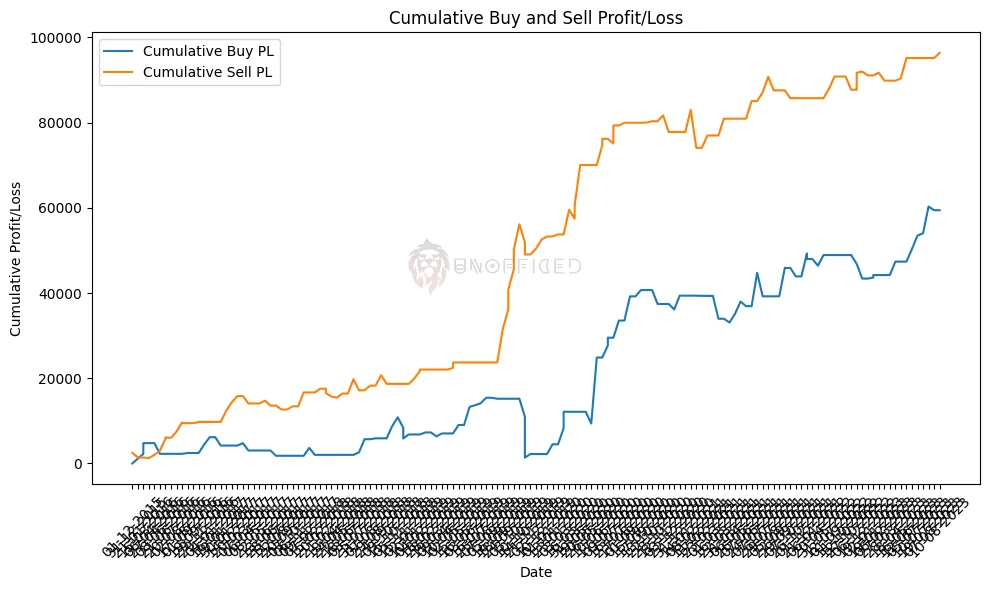
Plotting the Equity Curve
Comparing the Performance Metrics with Intraday Strategy
While it may be intriguing to observe the evolution of performance metrics in the Positional Strategy’s results, a comprehensive analysis requires a side-by-side comparison with the Intraday Strategy’s data. Without this comparative context, it’s challenging to draw meaningful conclusions.
Therefore, let’s proceed to examine both strategies in parallel to gain a more insightful perspective.
Index IB Intraday
					Net of buy_pl_points: 2221.00000000001
Net of sell_pl_points: 4721.430000000011
Positive buy_pl_points count: 46
Negative buy_pl_points count: 27
Total buy_pl_points count: 171
Positive sell_pl_points count: 60
Negative sell_pl_points count: 24
Total sell_pl_points count: 171
					Average of buy_pl_points: 347.5760233918145
Average of sell_pl_points: 563.6125730994178
Average of positive buy_pl_points: 2607.565217391311
Average of positive sell_pl_points: 2375.0291666666717
Average of negative buy_pl_points: -2241.203703703704
Average of negative sell_pl_points: -1921.8333333333273
Index IB Positional
					Net of buy_pl_points: 2353.149999999995
Net of sell_pl_points: 9827.360000000015
Positive buy_pl_points count: 65
Negative buy_pl_points count: 60
Total buy_pl_points count: 171
Positive sell_pl_points count: 52
Negative sell_pl_points count: 67
Total sell_pl_points count: 171
					Average of buy_pl_points: 779.7923976608148
Average of sell_pl_points: 988.0000000000003
Average of positive buy_pl_points: 6082.5269230769145
Average of positive sell_pl_points: 8048.600961538459
Average of negative buy_pl_points: -4366.995833333334
Average of negative sell_pl_points: -3725.0634328358174
Risk Tolerance:
Intraday Strategy: This strategy exhibited a mixed risk profile. While it had a higher number of winning trades, it also had a notable number of losing trades. The average losses, particularly in the buy-point trades, were significant. Traders with moderate to high risk tolerance may consider this strategy due to its potential for both gains and losses.
Positional Strategy: The Positional strategy also displayed mixed results but with a higher net profit. It had more winning trades than losing ones, and the average profits outweighed the average losses. Investors with moderate risk tolerance may find this strategy appealing.
Return Expectations:
Intraday Strategy: This strategy generated a positive net profit, but the average profits per trade were relatively lower compared to the Positional strategy. Traders may expect moderate returns with the possibility of occasional losses.
Positional Strategy: The Positional strategy produced a higher net profit, and the average profits per trade were notably higher than in the Intraday strategy. Investors may expect potentially higher returns, but they should also be prepared for some losing trades.