Backtesting Narrow Range Inside Bar Strategy Using Python

When we mention the “Narrow Range Inside Bar,” we are specifically referring to stocks that meet two criteria: they appear in the Narrow Range 7 (NR7) scanner and also exhibit the characteristics of an inside bar pattern.
However, as you have already gone through the earlier chapters of backtesting, You can try out the backtesting method on the scanner of Double Narrow Range 7.
Prerequisite
In the previous chapters,
- We have backtested the Double Inside Bar Intraday Strategy.
- We have also discussed Double Inside Bar Positional Strategy.
The only thing that needs changing in the code is the dataset because everythin g else exactly the same! So double_ib.csv will become nr7.csv which was shared in the earlier chapter. It contains all the FNO stocks that has exhibited Triple Inside Bar Pattern since 2015 to today.
					df = pd.read_csv("/root/apps/trident/double_ib.csv")
df
will become –
					df = pd.read_csv("/root/apps/trident/nr7.csv")
df
Now, let’s introduce an intriguing twist.
Up until now, we’ve been exploring just two exit methods: same-day exit and exit after 5 days. But what if we experiment with a different approach? How about exiting after just 2 days, meaning the trade closes on the next trading day? (In the event that the next day is a holiday, the trade will be exited on the same day.)
Anyways, to do that, We need to change the check_high_breakout_and_save function we designed in our earlier chapter.
to_date = from_date + datetime.timedelta(hours=5)
becomes –
to_date=from_date+ datetime.timedelta(days=2)
You are welcome to try out different outcomes and play with both the entry and exit conditions!
Comparing the Performance Metrics with Index Inside Bar Intraday Strategy
As the entire codebase will be same, there is no need to re-invent the wheel. Therefore, let’s proceed to examine the three strategies in parallel to gain a more insightful perspective. Now, it will look nasty in mobile, so it is better You view this in Desktop.
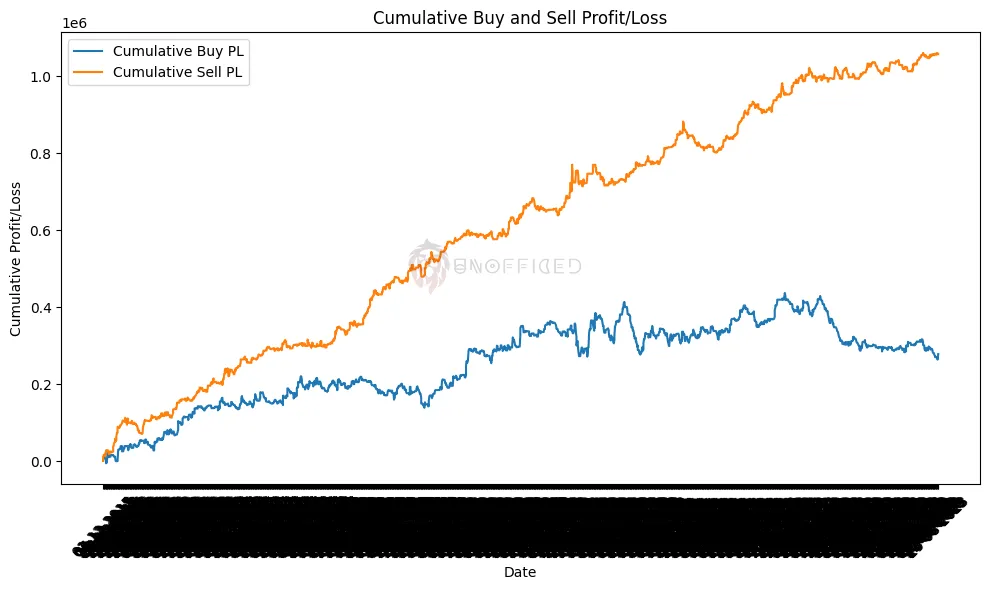
NR7 + IB Intraday
					Net of buy_pl_points: 278051.6199999994
Net of sell_pl_points: 1057877.7299999995
Positive buy_pl_points count: 546
Negative buy_pl_points count: 611
Total buy_pl_points count: 2238
Positive sell_pl_points count: 642
Negative sell_pl_points count: 484
Total sell_pl_points count: 2238
					Average of buy_pl_points: 124.24111706881118
Average of sell_pl_points: 472.68888739946357
Average of positive buy_pl_points: 5465.013040293043
Average of positive sell_pl_points: 4582.949080996886
Average of negative buy_pl_points: -4428.552373158758
Average of negative sell_pl_points: -3893.337975206613
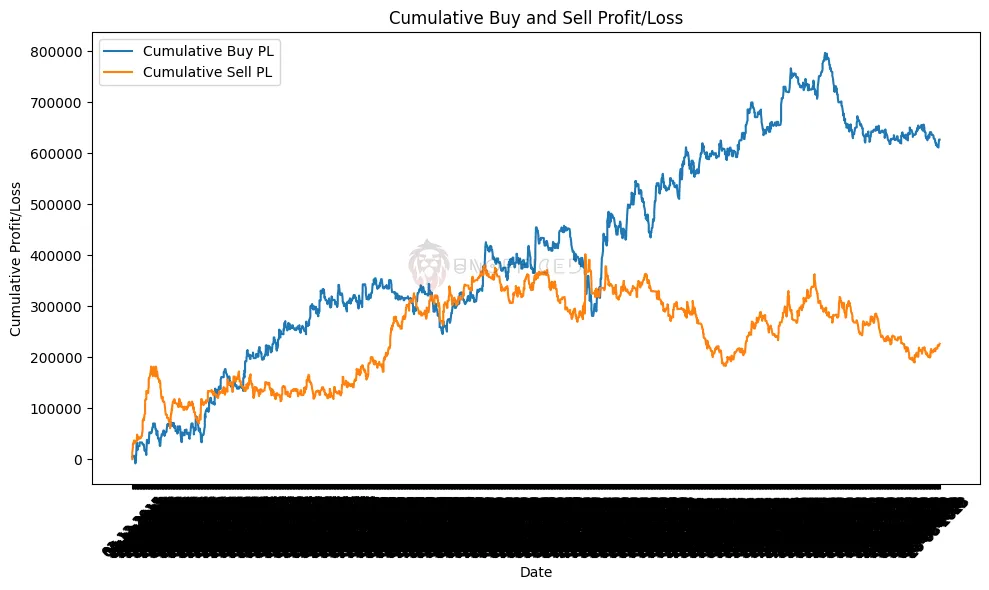
NR7 + IB Next Day
					Net of buy_pl_points: 626660.7300000007
Net of sell_pl_points: 226256.93000000028
Positive buy_pl_points count: 631
Negative buy_pl_points count: 724
Total buy_pl_points count: 2239
Positive sell_pl_points count: 633
Negative sell_pl_points count: 718
Total sell_pl_points count: 2239
					Average of buy_pl_points: 279.88420276909363
Average of sell_pl_points: 101.0526708351944
Average of positive buy_pl_points: 7095.479698890652
Average of positive sell_pl_points: 5810.943080568722
Average of negative buy_pl_points: -5318.490276243095
Average of negative sell_pl_points: -4807.896991643455
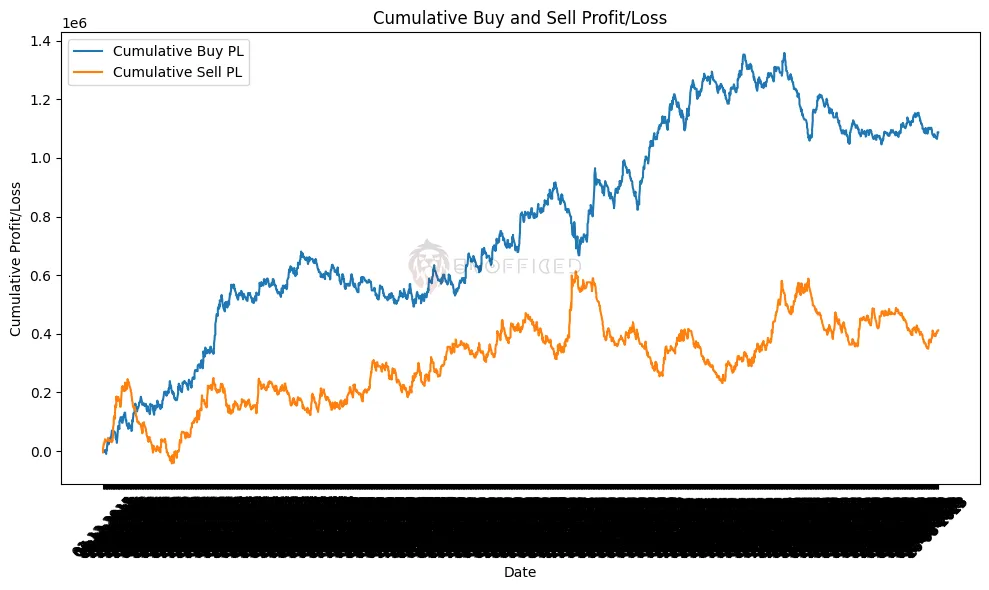
NR7+IB Positional
					Net of buy_pl_points: 1087522.4300000002
Net of sell_pl_points: 412298.9700000003
Positive buy_pl_points count: 703
Negative buy_pl_points count: 968
Total buy_pl_points count: 2239
Positive sell_pl_points count: 686
Negative sell_pl_points count: 967
Total sell_pl_points count: 2239
					Average of buy_pl_points: 485.71792317999115
Average of sell_pl_points: 184.14424743188937
Average of positive buy_pl_points: 11341.583883357043
Average of positive sell_pl_points: 10449.738644314868
Average of negative buy_pl_points: -7113.234545454547
Average of negative sell_pl_points: -6986.785667011374
Key Insights from Strategy Analysis
After a thorough analysis of the trading strategies, we’ve unearthed some intriguing findings:
- Intraday vs. Positional Exit: The sell strategies exhibit exceptional performance when considering an intraday exit. These strategies seem particularly well-suited for short-term trading.
- Buy Strategies’ Strength: On the flip side, the buy strategies shine when opting for a next-day exit or the positional exit after a 5-day holding period. These approaches demonstrate their effectiveness in capturing larger market movements.
- Exit Comparison: While the 5-day positional exit strategy boasts superior returns compared to a next-day exit, it’s noteworthy that the next day’s return still amounts to nearly 50% of the 5-day positional strategy’s return. This aspect provides food for thought for traders exploring different exit approaches.