Backtesting Double Inside Bar Intraday Strategy Using Python

In the last chapter, We have backtested the Index Inside Bar Intraday Strategy.
The only thing that needs changing in the code is the dataset because everythin g else exactly the same! So index_ib.csv will become double_ib.csv which was shared in the earlier chapter. It contains all the FNO stocks that has exhibited Double Inside Bar Pattern since 2015 to today.
					df = pd.read_csv("/root/apps/trident/index_ib.csv")
df
will become –
					df = pd.read_csv("/root/apps/trident/double_ib.csv")
df
The output looks like –
					sector	marketcapname	symbol	date
0	Wed Aug 30 2023, 5:56 pm	1	BALKRISIND	30-08-2023
1	Industrials	Largecap	JKCEMENT	01-12-2015
2	Industrials	Midcap	AARTIIND	02-12-2015
3	Pharmaceuticals	Largecap	SYNGENE	02-12-2015
4	Industrials	Largecap	SHREECEM	03-12-2015
...	...	...	...	...
3924	FMCG	Largecap	CUMMINSIND	29-08-2023
3925	Auto	Largecap	ESCORTS	29-08-2023
3926	Services	Largecap	INDHOTEL	29-08-2023
3927	Media	Largecap	ZEEL	29-08-2023
3928	Finance	Midcap	CANFINHOME	29-08-2023
3929 rows × 4 columns
It is exactly similar to the output of the dataset of Inside bars on Index. Now, there were 563 rows there. We have 3929 rows here. So, the program will also take 8 time longer to process as there is 8 times more data.
Adding the Lot Size
Introducting an Uniform Quant
New Code –
					import math
quant_size = 500000
df["lotsize"] = df["today_open"].apply(lambda x: math.floor(quant_size/x))
df["buy_pl_points"] = df["buy_pl_points"]*df["lotsize"]
df["sell_pl_points"] = df["sell_pl_points"]*df["lotsize"]
df
Old Code –
					def calculate_lotsize(row):
    if row["symbol"] == "BANKNIFTY":
        return 15
    elif row["symbol"] == "NIFTY":
        return 50
    else:
        return 40

df["lotsize"] = df.apply(calculate_lotsize, axis=1)
df["buy_pl_points"] = df["buy_pl_points"]*df["lotsize"]
df["sell_pl_points"] = df["sell_pl_points"]*df["lotsize"]
Plotting the Equity Curve
Comparing the Performance Metrics with Index Inside Bar Intraday Strategy
While it may be intriguing to observe the evolution of performance metrics in the Index Inside Bar’s Intraday Strategy’s results, a comprehensive analysis requires a side-by-side comparison with the data. Without this comparative context, it’s challenging to draw meaningful conclusions.
Therefore, let’s proceed to examine both strategies in parallel to gain a more insightful perspective.
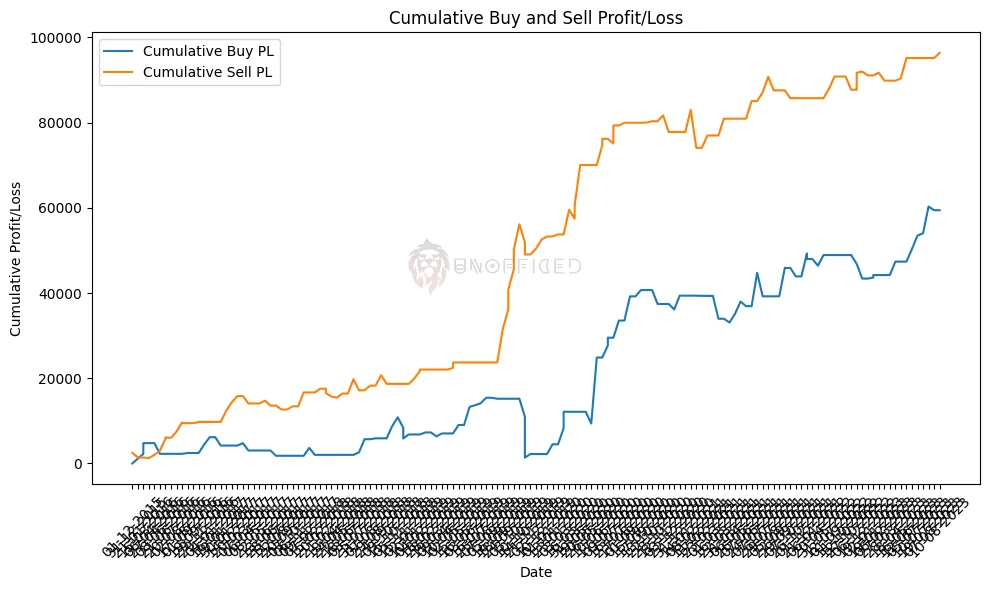
Index IB Intraday
					Net of buy_pl_points: 2221.00000000001
Net of sell_pl_points: 4721.430000000011
Positive buy_pl_points count: 46
Negative buy_pl_points count: 27
Total buy_pl_points count: 171
Positive sell_pl_points count: 60
Negative sell_pl_points count: 24
Total sell_pl_points count: 171
					Average of buy_pl_points: 347.5760233918145
Average of sell_pl_points: 563.6125730994178
Average of positive buy_pl_points: 2607.565217391311
Average of positive sell_pl_points: 2375.0291666666717
Average of negative buy_pl_points: -2241.203703703704
Average of negative sell_pl_points: -1921.8333333333273
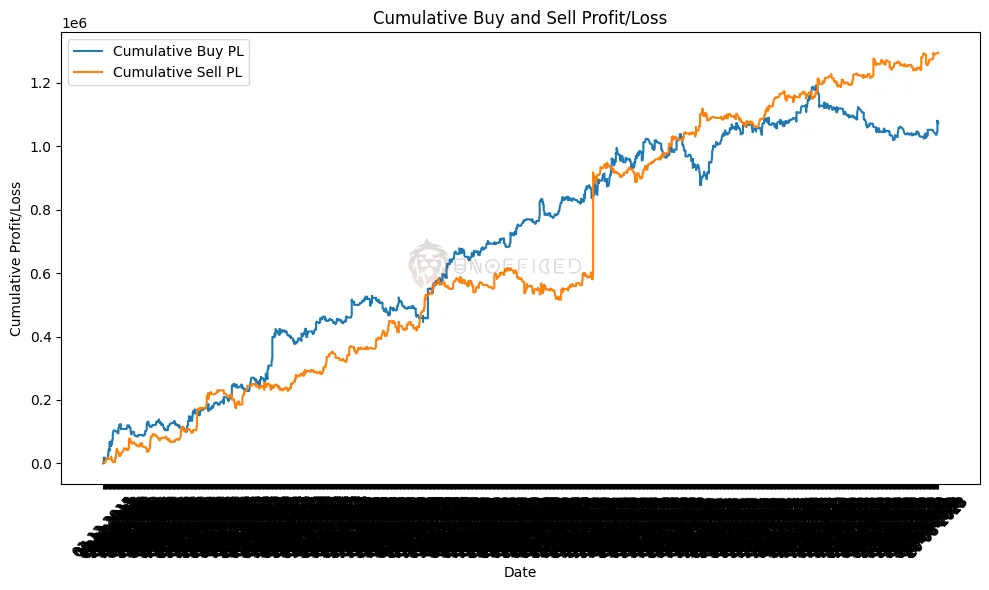
Double IB Intraday
					Net of buy_pl_points: 1072125.2599999963
Net of sell_pl_points: 1294312.709999999
Positive buy_pl_points count: 586
Negative buy_pl_points count: 624
Total buy_pl_points count: 2479
Positive sell_pl_points count: 635
Negative sell_pl_points count: 551
Total sell_pl_points count: 2479
					Average of buy_pl_points: 432.4829608713176
Average of sell_pl_points: 522.110814844695
Average of positive buy_pl_points: 6782.096245733783
Average of positive sell_pl_points: 5536.072881889762
Average of negative buy_pl_points: -4650.93451923077
Average of negative sell_pl_points: -4031.022813067151
The only conclusion We get from here is – If the Index Inside Bar Strategy triggers a sell trade, then the amount of profit, if happens will be high! However, in both case, the sell trades in net makes more money than the buy trades.