Backtesting Double Inside Bar Positional Strategy Using Python

Prerequisite
In the last chapters,
- We have backtested the Double Inside Bar Intraday Strategy.
- We have also discussed Index Inside Bar Positional Strategy.
So, We need to change the check_high_breakout_and_save function we designed in Index Inside Bar Positional Strategy Chapter. Then, We can just follow the rest of the codebase of Double Inside Bar Intraday Strategy Chapter as it is. So,
to_date = from_date + datetime.timedelta(hours=5)
becomes –
to_date=from_date+ datetime.timedelta(days=5)
You can download the rest of the check_high_breakout_and_save function from Index Inside Bar Positional Strategy Chapter. Let’s not discuss the same thing over and over again complicating things –
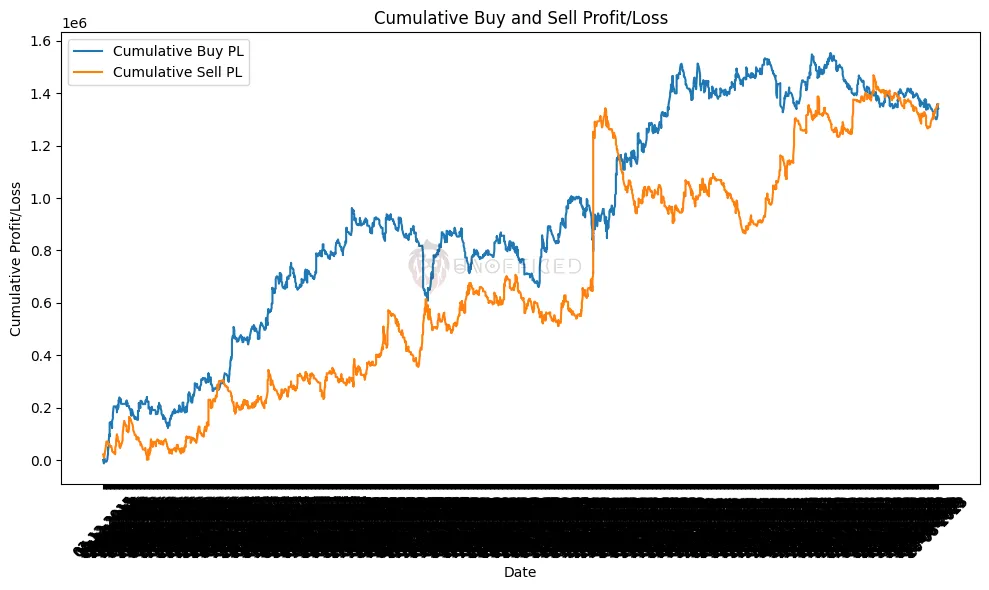
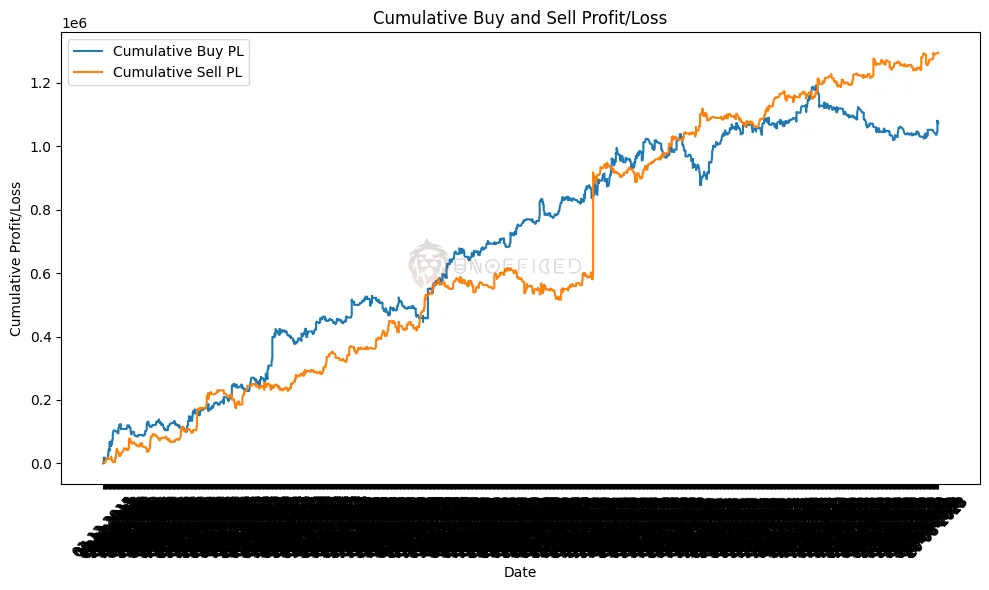
Plotting the Equity Curve
Comparing the Performance Metrics with Intraday Strategy
While it may be intriguing to observe the evolution of performance metrics in the Positional Strategy’s results, a comprehensive analysis requires a side-by-side comparison with the Intraday Strategy’s data. Without this comparative context, it’s challenging to draw meaningful conclusions.
Therefore, let’s proceed to examine both strategies in parallel to gain a more insightful perspective.
Double IB Intraday
					Net of buy_pl_points: 1072125.2599999963
Net of sell_pl_points: 1294312.709999999
Positive buy_pl_points count: 586
Negative buy_pl_points count: 624
Total buy_pl_points count: 2479
Positive sell_pl_points count: 635
Negative sell_pl_points count: 551
Total sell_pl_points count: 2479
					Average of buy_pl_points: 432.4829608713176
Average of sell_pl_points: 522.110814844695
Average of positive buy_pl_points: 6782.096245733783
Average of positive sell_pl_points: 5536.072881889762
Average of negative buy_pl_points: -4650.93451923077
Average of negative sell_pl_points: -4031.022813067151
Double IB Positional
					Net of buy_pl_points: 1342170.9899999984
Net of sell_pl_points: 1359112.0599999984
Positive buy_pl_points count: 737
Negative buy_pl_points count: 1042
Total buy_pl_points count: 2479
Positive sell_pl_points count: 768
Negative sell_pl_points count: 993
Total sell_pl_points count: 2479
					Average of buy_pl_points: 541.4162928600235
Average of sell_pl_points: 548.2501250504229
Average of positive buy_pl_points: 12614.405644504748
Average of positive sell_pl_points: 11654.301354166666
Average of negative buy_pl_points: -7634.0172456813825
Average of negative sell_pl_points: -7644.905720040283