SunTV Futures Trade Using Bollinger Bands

Setup
This case study examines a short trade in Sun TV May Futures on a 15-minute timeframe. The entry is executed based on the rules of the Bollinger Band Ride (BBR) sell setup, which is designed to capture momentum when prices move strongly along the lower band.
Trade Analysis
The chart below shows the price action leading to the trade entry and the subsequent development. The trade adheres strictly to the established BBR framework.
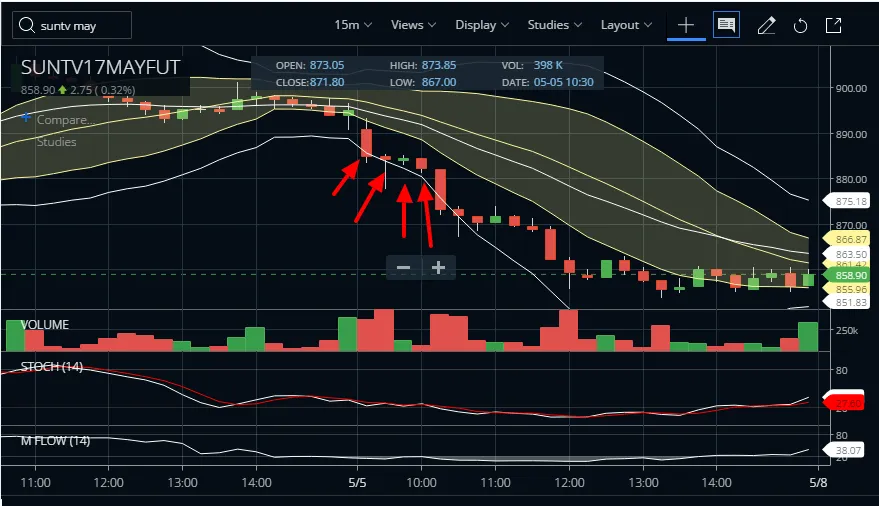
The sequence of events is as follows:
- Candle 1: A strong red candle closes below the lower Bollinger Band, indicating bearish momentum.
- Candle 2: Another red candle confirms the momentum. A sell order is entered at the close of this candle, at a price of 883.95. The position is now short, anticipating a continued ride down the band.
- Candle 3: This is a green candle, showing a slight pullback. However, for a BBR trade, this does not constitute an exit signal. The position is held.
- Candle 4: Price action continues. The high of Candle 3 (885.00) was a point of interest for a potential 3BB (3-Bar Bollinger Band) reversal buy setup, but the price never broke above this level. Therefore, the long setup did not trigger, and the initial BBR short trade remains the only active position.
Exit Strategy: BBR vs. 3BB
Understanding the different exit rules for BBR and 3BB setups is critical for correct execution.
For a standard Bollinger Band Ride (BBR), the exit is mechanical: the position is closed if and when a candle closes across the median Bollinger Band. This strategy inherently contains risk, as a failure for the price to cross back over the median often signifies a powerful trend with substantial profit potential.
In contrast, for a 3BB setup, the initial stop-loss is placed manually at the high (for a buy trade) or low (for a sell trade) of the third candle in the pattern. Because a 3BB setup is expected to cross the median with conviction, the stop is typically held at this initial level until the crossover occurs. After a successful median crossover, the position is managed with a trailing stop-loss, often based on the previous candle’s high or low.
Takeaway
This trade demonstrates the importance of disciplined execution. A valid BBR trade should be managed according to its own rules—entry on confirmation and exit on a median crossover. Potential signals from other patterns are irrelevant until they are confirmed and a new trade decision is made.