What is Price Action?

If you want to stay batman, declare “I want to stay Batman” and stay true to your superhero identity! Don’t let Gotham down.
- What does the word “Security” mean?
- What is Technical Analysis?
- What is Fundamental Analysis?
- What is Price Action?
- Is Price Action Fundamental Analysis or Technical Analysis?
- When Price Action does not work?
- Why Price Action does not work in Illiquidity?
- How Cognitive Bias Impacts the Market?
- Does Price Action Work in News Events?
- How does Price Action react to Natural Calamities like earthquakes, tsunamis etc?
- What is the role of Price Action In highly manipulated markets?
- What does Price Action do in Low Volatility?
- What is Dow Theory?
- The six tenets of Dow Theory
- Dow Jones Industrial Average (DJIA)
- Dow Jones Transportation Average
- How do Price Action and Dow Theory Work?
- What is good liquidity in terms of Price Action?
- How to identify good liquidity scripts?
Security:
In the context of finance and investing, the term “security” refers to a financial asset that has value and can be traded. Securities can take many forms, such as stocks, bonds, options, futures contracts, and other financial instruments.
Technical Analysis:
Technical analysis is a method of evaluating securities by analyzing statistics generated by market activity, such as past prices and volume.
Technical analysts believe that historical price data can provide insights into the future direction of a security’s price, as well as its potential support and resistance levels.
Fundamental Analysis:
Fundamental analysis is a method of evaluating securities by examining the underlying economic and financial factors that affect their value.
Fundamental analysts believe that by understanding the fundamental factors that drive the value of a security, they can make more informed decisions about buying, selling, or holding that security.
What is Price Action:
Price Action refers to the analysis of the price movement of a financial asset, such as a stock, currency, or commodity, to identify patterns, trends, and potential trading opportunities.
Is Price Action Fundamental Analysis or Technical Analysis:
Price action does not mean technical analysis only. Price action analysis involves analyzing the price movements of a security to identify patterns and potential trading opportunities, which can be done using both technical and fundamental analysis methods.
For example, a trader might use technical analysis to identify a bullish chart pattern in a stock, such as an uptrend, and then use fundamental analysis to confirm that the company’s financials are strong and that the stock has a favorable outlook.
Core Idea of Price Action:
Price Action trading is based on the idea that the price movement of a security reflects all available market information, including supply and demand, market sentiment, and other factors that can influence the price.
In general, price action analysis is a flexible approach that can incorporate a variety of different analysis methods, depending on the trader’s preferences and the specific security being analyzed. By combining different analysis methods, traders can gain a more well-rounded understanding of a security’s price movement and make more informed trading decisions.
When Price Action does not work –
There are certain scenarios in which price action trading may not work as well as expected. Here are a few examples:
- During periods of low liquidity: Price action trading relies on the ability to identify trends and patterns in price movement. However, during periods of low liquidity, the market may be more prone to erratic or unpredictable price movements, which can make it difficult to identify clear trends or patterns.
- During news events or market shocks: Price action trading is based on historical price movements and patterns, and may not be as effective in predicting or reacting to sudden news events or market shocks. In such scenarios, fundamental analysis or other strategies may be more appropriate.
- In highly manipulated markets: In some markets, particularly those that are prone to price manipulation or insider trading, price action analysis may be less reliable. This is because price movements may be artificially inflated or suppressed, making it difficult to accurately interpret the underlying trends and patterns.
- In markets with low volatility: Price action trading relies on volatility and price movement to identify trends and patterns. In markets with low volatility, price movements may be less pronounced, making it more difficult to identify clear patterns or trends.
Overall, while price action trading can be an effective strategy in many scenarios, it is important to be aware of the limitations and potential pitfalls of this approach and to be willing to adjust or adapt one’s trading strategy as needed in response to changing market conditions.
During periods of low liquidity: Price action trading relies on the ability to identify trends and patterns in price movement. However, during periods of low liquidity, the market may be more prone to erratic or unpredictable price movements, which can make it difficult to identify clear trends or patterns.
- Low liquidity means there are fewer buyers and sellers in the market, which can make it more difficult to execute trades and can lead to wider bid-ask spreads.
- In a low-liquidity market, a single large order can have a significant impact on the price of a security, potentially leading to price manipulation or unexpected price movements.
- Low liquidity can make it more difficult to accurately read price action signals, as there may be less meaningful price movement or fewer meaningful patterns to analyze.
- A lack of liquidity can make it more difficult to exit a position, particularly in a fast-moving market, which can increase the risk of losses for traders and investors.
- Low liquidity markets can be more volatile and subject to sudden price swings, as there may be less stability and less of a cushion to absorb unexpected shocks or market events.
- Penny stocks: Stocks that are trading at very low prices, often less than Rs. 10, and have low trading volumes can be illiquid and difficult to trade. These stocks may be prone to sudden price swings and price manipulation due to low liquidity.
- Small-cap and mid-cap stocks: Smaller companies with market capitalizations below Rs. 500 crores.
- Futures and options contracts:
- Debentures and bonds:
Exception Case where Price Action is working in illiquid security:
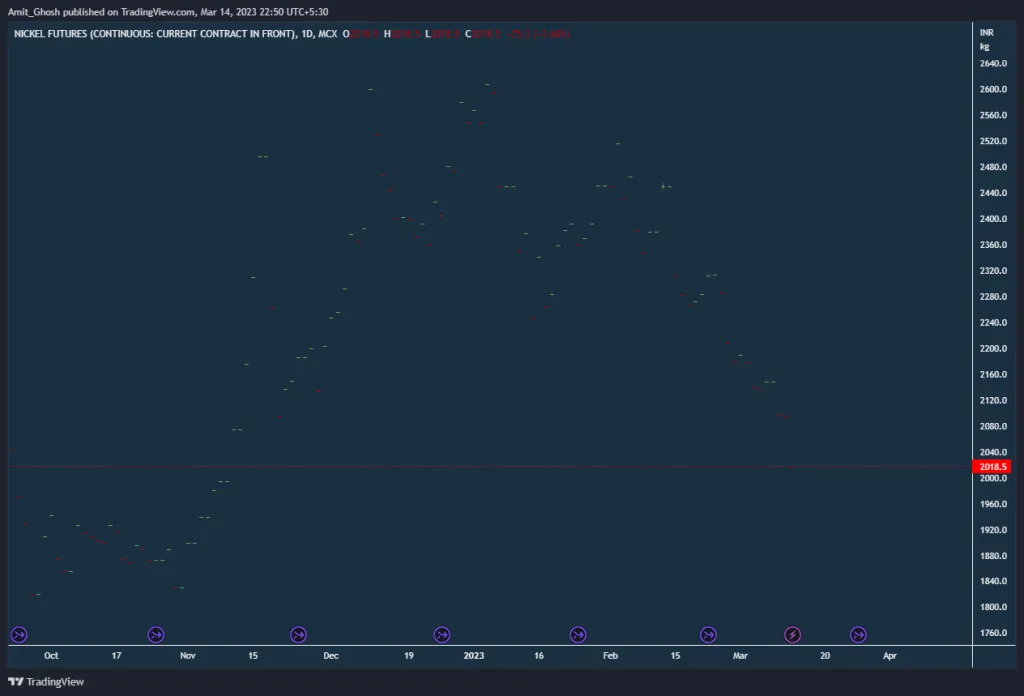
Here is a special case of a snapshot of Nickel Futures. It is entirely illiquid but from our naked eye, We can see a pattern here
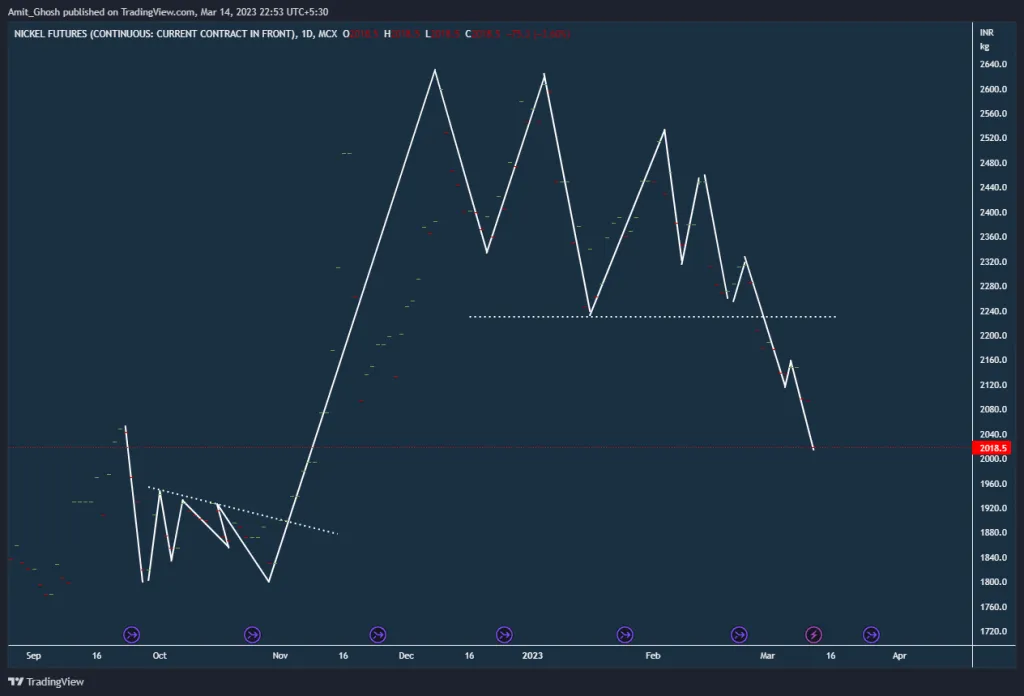
A range of machine learning algorithms and statistical models are employed to detect such underlying patterns. From our naked eye, We can spot tradeable opportunities as shown in the dotted lines in the above chart.
How Cognitive Bias plays role on Share Market
In our everyday lives, we often believe that the more expensive an item is, the more valuable it is. For example, a bike that costs 60,000 INR is generally perceived to be more valuable than a pen that costs 10 INR. However, when it comes to the stock market, this assumption doesn’t always hold true.
The price of a stock does not reflect its true value in terms of market capitalization.
- BPCL is trading at 2279.45. The market capitalization of BPCL is 70761.02Cr.
- IOCL is trading at 77.70. The market capitalization of IOCL is 109722.02Cr.
BPCL stands for Bharat Petroleum Corporation Limited, which is a state-owned oil and gas company in India. IOCL stands for Indian Oil Corporation Limited, which is also a state-owned oil and gas company in India.
Market capitalization is calculated by multiplying the total number of outstanding shares of a company by its current stock price.
In the case of BPCL and IOCL, even though BPCL has a higher stock price than IOCL, IOCL has a larger market capitalization because it has a larger number of outstanding shares. Therefore, it’s important to look at market capitalization along with other factors when analyzing a company’s stock.
The cognitive bias at play here is related to the belief that stocks with a higher share price will have less potential for growth compared to stocks with a lower share price.
A cognitive bias refers to a systematic error in thinking or decision-making that can result in irrational or illogical judgments. These biases are often the result of mental shortcuts or heuristics that our brain uses to process information quickly.
Failing to cover small but important topics like this in the basics can be a major issue for newcomers to the stock market.
During news events or market shocks: Price action trading is based on historical price movements and patterns, and may not be as effective in predicting or reacting to sudden news events or market shocks. In such scenarios, fundamental analysis or other strategies may be more appropriate.
When a company’s results or a significant event is expected to occur in the short term, Price Action Analysis becomes irrelevant. In such cases, the only purpose of Price Action is to identify trades with low risk and high potential rewards.
Silicon Valley Bank from America has collapsed. The news triggered a sell-off in all the markets. In the image, We can see Reliance, SBI, and our major indexes – NIFTY and BANK NIFTY are also collapsing.
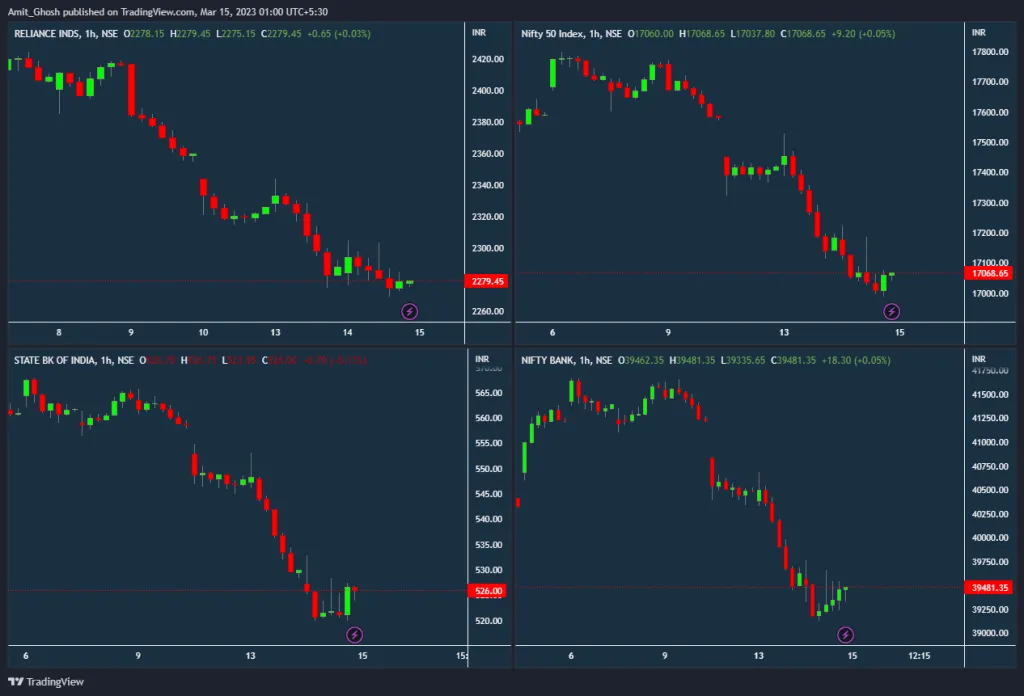
But Why did America’s Bank collapse trigger the fall in Reliance Industries of India?
It’s called Cascading Effect. We will discuss it later.
Here are some examples of sudden news events or market shocks in the Indian stock market where price action trading may not have been effective:
- Demonetization of high-value currency notes in 2016.
- Announcement of long-term capital gains tax on equities in the 2018 Budget.
- Suspension of trading in Yes Bank shares in 2020.
- Announcement of nationwide lockdown due to the COVID-19 pandemic in 2020.
- Imposition of trade tariffs by the US on Indian goods in 2018.
- Announcement of the merger of public sector banks in 2019.
- RBI’s decision to cut repo rates unexpectedly in 2020.
- Announcement of the ban on Chinese mobile applications in 2020.
- RBI’s decision to place restrictions on withdrawals from PMC Bank in 2019.
In fact, In 2008, the global financial crisis caused a sharp decline in the Indian stock market, with the benchmark index, the Sensex, dropping nearly 60%.
Further Read:
The Linchpin Effect
BTST trading in Indian stocks – Salman Khan effect

- September 11, 2001 – Terrorist attacks in the United States led to a global sell-off in markets, including the NIFTY index.
- December 26, 2004 – The Indian Ocean earthquake and tsunami led to a sell-off in markets, including the NIFTY index, due to fears of economic disruption.
- November 26, 2008 – Terrorist attacks in Mumbai led to a drop in the NIFTY index as investors worried about the impact on India’s economy and stability.
- October 29-30, 2012 – Superstorm Sandy hit the east coast of the United States, leading to a drop in the NIFTY index due to fears of global economic disruption.
- August 25, 2017 – Hurricane Harvey hit the US, leading to a drop in the NIFTY index as investors worried about the impact on the global economy.
- March 11, 2011 – The earthquake and tsunami in Japan led to a drop in the NIFTY index as investors worried about the impact on the global supply chain.
Note: The impact of natural calamities and terrorist attacks on the NIFTY index may vary depending on the severity of the event, the global economic context, and other factors.
Here is one such case where the word “severity” comes in –
How Rain in Brazil impacts Indian Coffee Companies
Rain in Brazil, which is the world’s largest producer and exporter of coffee, can have an indirect impact on the Indian coffee industry. Brazil is a major producer of arabica coffee, which is a premium variety commonly used in specialty coffee blends. If the rainfall in Brazil affects the production of arabica coffee, it could potentially increase the price of coffee globally, including in India.
According to the International Coffee Organization, Brazil produced around 37% of the total global coffee production. In contrast, India produced around 3.2% of the total global coffee production. So, if they are unable to supply, the price of coffee will increase and our companies will benefit!
Further Read:
The Mosquito-Elephant Impact in the stock market
Disaster Capitalism and Indian Share Market
In highly manipulated markets: In some markets, particularly those that are prone to price manipulation or insider trading, price action analysis may be less reliable. This is because price movements may be artificially inflated or suppressed, making it difficult to accurately interpret the underlying trends and patterns.
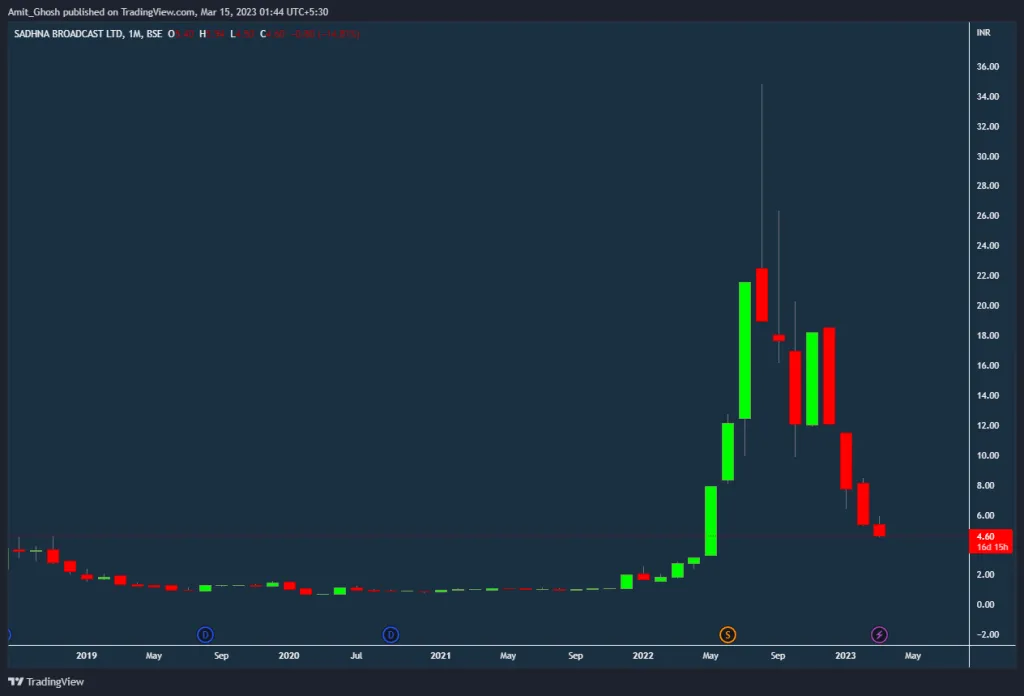
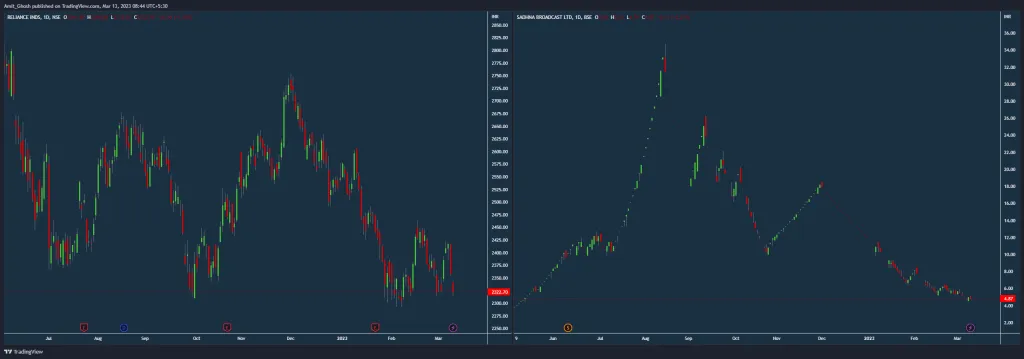
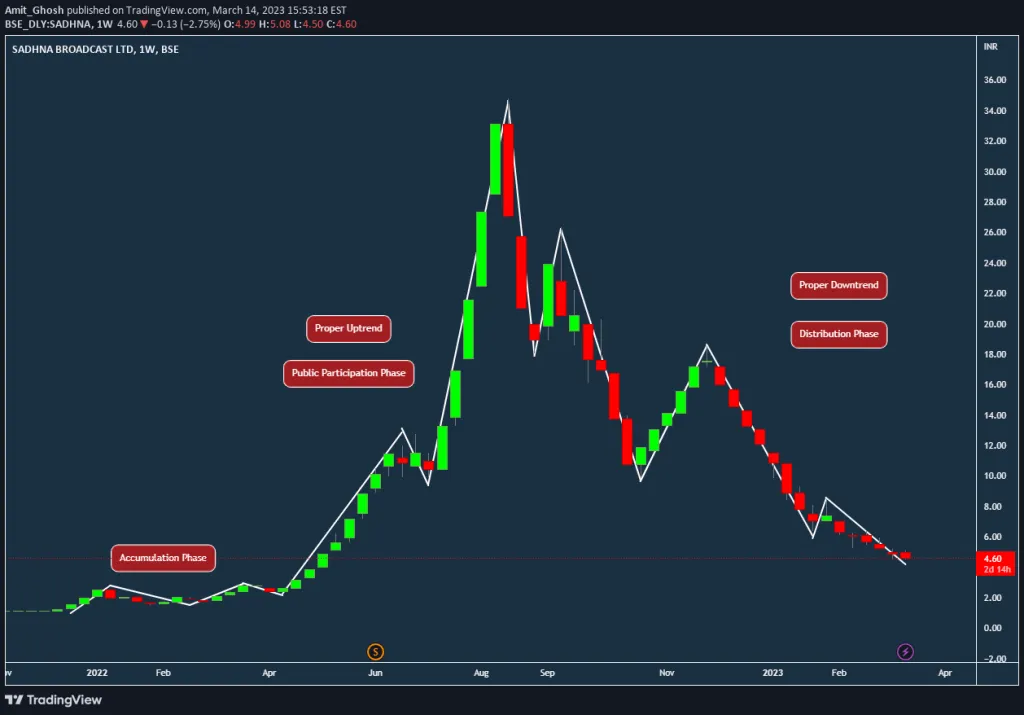
Here is a chart of Sadhna Broadcast in a monthly timeframe.
Promoters of Sadhna Broadcast, along with actor Arshad Warsi and others, have been banned by SEBI from the securities market. The ban comes after complaints alleging that misleading YouTube videos with false content about the company were uploaded to lure investors. You can read about it in more detail here –
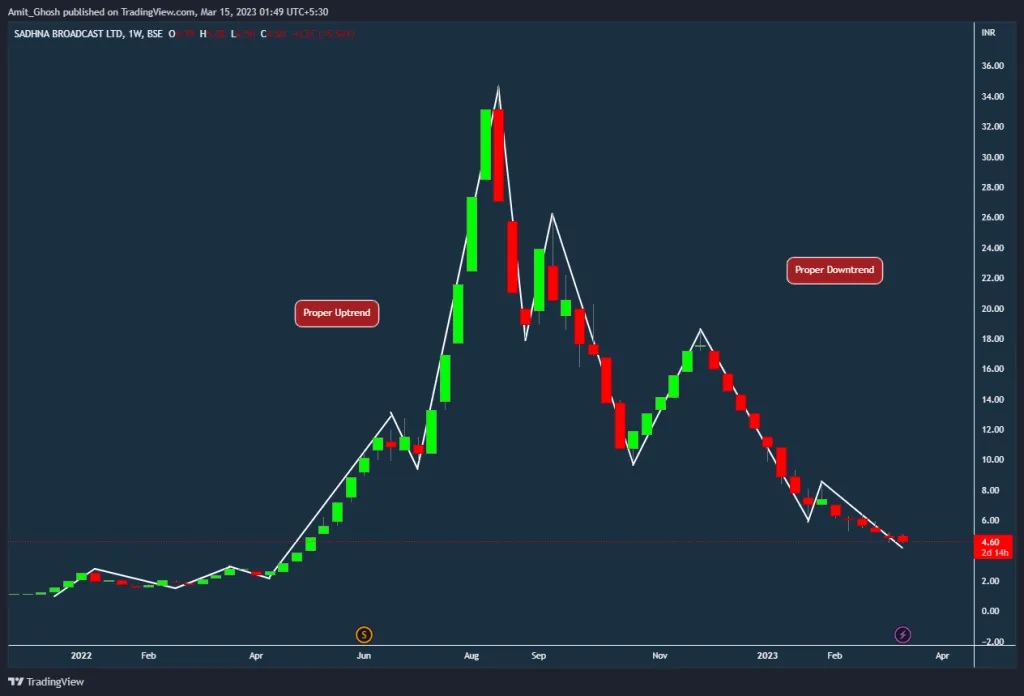
Although the chart of the same company in the weekly timeframe shows a clean uptrend and downtrend, there is still a possibility that the trend may change due to unexpected news events or market shocks.
What if SEBI halts trading here ?
That’s why it is written, “Price action analysis may be less reliable”.
And, that’s above example is why Price Action traders do not care for any news because Price tells the story anyways. That’s why, as said earlier – In such cases, the only purpose of Price Action is to identify trades with low risk and high potential rewards.
In markets with low volatility: Price action trading relies on volatility and price movement to identify trends and patterns. In markets with low volatility, price movements may be less pronounced, making it more difficult to identify clear patterns or trends.
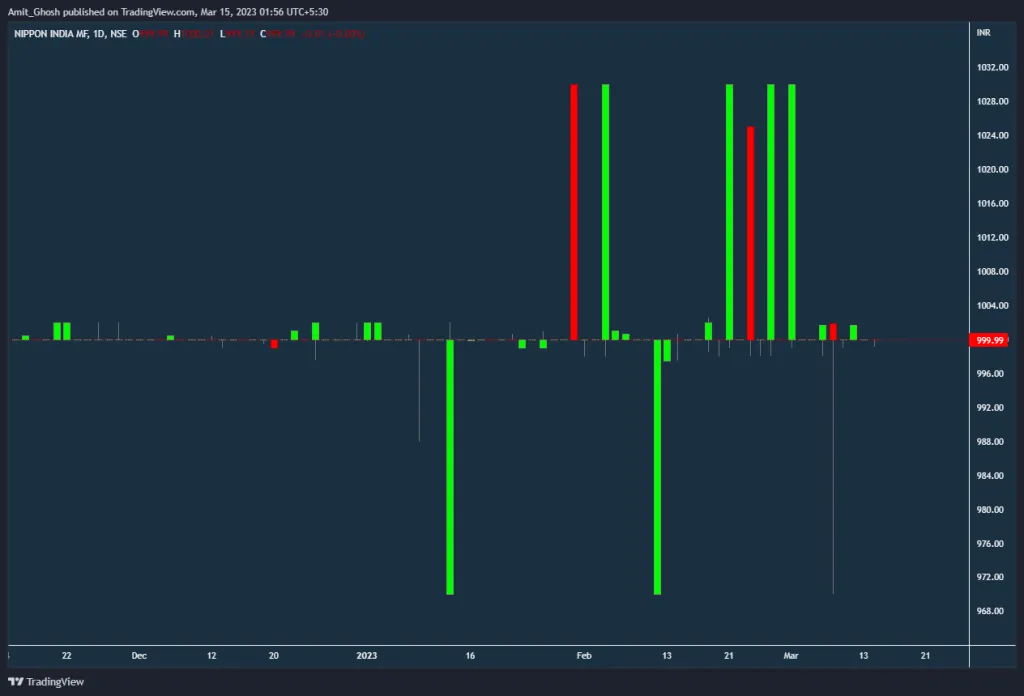
Here is a chart of Liquidbees in a daily timeframe.
LiquidBees is an exchange-traded fund (ETF) in India that invests in highly liquid money market instruments.It’s highly liquid but not volatile at all. There is no price action here. In fact, there is no action here!
Further Read
What is LiquidBees in Indian Stock Market
And, that’s above example is why Price Action traders do not care for any news because Price tells the story anyways.
In the context of the Sadhna Broadcast, we can observe that the price movement of the stock clearly indicated the entry and exit timings, even without insider information. Price action traders aim to enter a trade at the beginning of an uptrend and exit at the beginning of a downtrend, regardless of any news or events that may be affecting the stock. Here, We must talk about Dow Theory.
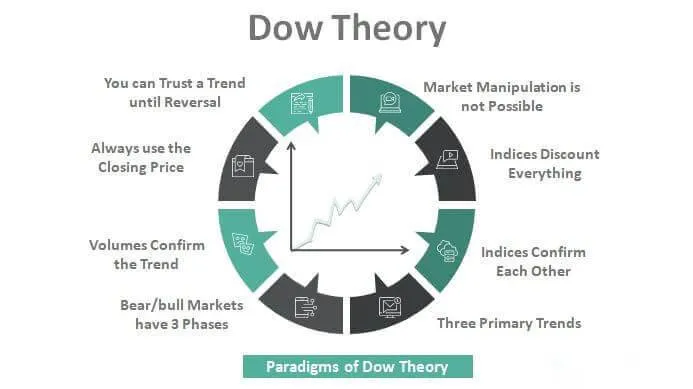
Dow Theory
Dow Theory is a technical analysis approach that was developed by Charles Dow, the founder of the Wall Street Journal, in the late 19th century.
The Dow Theory is based on six principles which are also called six tenets.

As Our mind will first connect the word “Tenet” with the movie, A tenet refers to a fundamental belief or principle that underlies a theory or system.
1. The market discounts everything –
- The market reflects all available information.
- In other words, all known information, including economic, financial, and political factors, is already priced into the market.
- This means that investors cannot gain an edge by using insider information or attempting to predict future events.
2. There are three trends –
- The market moves in three trends: primary, secondary, and minor.
- Primary trends are the longest and most significant, lasting for several months to several years.
- Secondary trends are shorter in duration and occur within the primary trend.
- Minor trends are the shortest and have little impact on the overall market direction.
3. Trends have three phases –
- The third tenet of Dow Theory states that trends have three phases – accumulation, public participation, and distribution.
- In the accumulation phase, smart money enters the market and begins buying shares.
- In the public participation phase, the general public begins to participate in the trend, driving prices higher.
- In the distribution phase, smart money begins to sell shares to the public, leading to a decline in prices.
4. The averages must confirm each other –
- Like all aliens attack only Newyork. The theory was first based on American Market as it is written by Americans.
- The fourth tenet of Dow Theory states that the Dow Jones Industrial Average (DJIA) and the Dow Jones Transportation Average (DJTA) must confirm each other to signal a trend change.
- If the DJIA is making new highs but the DJTA is not, it could indicate weakness in the market.
5. Volume should confirm the trend –
- In an uptrend, the volume should increase as prices rise and decrease as prices fall.
- In a downtrend, the volume should increase as prices fall and decrease as prices rise.
- If the volume does not confirm the trend, it could indicate weakness in the market.
6. Trends persist until there is a clear reversal –
- The sixth and final tenet of Dow Theory states that trends persist until they signal a reversal.
- A reversal occurs when the market averages fail to confirm each other, or when volume fails to confirm the trend.
- Once a reversal is confirmed, a new trend begins.
Dow Jones Industrial Average (DJIA)
The Dow Jones Industrial Average (DJIA), also known as the Dow, is a stock market index that tracks the performance of 30 large, publicly-owned companies listed on the New York Stock Exchange (NYSE) and the NASDAQ. The DJIA was created in 1896 by Charles Dow. It is the same guy who coined “Dow Theory”.
The DJIA is often used as a benchmark for the overall performance of the US stock market and as a gauge of investor sentiment.
We can compare this with our NIFTY50 Index.
Dow Jones Transportation Average
The Dow Jones Transportation Average, also known as the “Dow Transports” or simply the “Transports,” is a price-weighted index that tracks the performance of 20 transportation-related stocks, including airlines, railroads, trucking companies, and shipping companies.
The Dow Transports is considered to be an important indicator of the health of the broader economy, as transportation companies are seen as a bellwether for economic activity. For example, if the Transports are rising, it suggests that demand for goods and services is increasing, as more products are being transported across the country. Conversely, if the Transports are falling, it suggests that economic activity may be slowing down.
The Dow Transports was also created by Charles Dow. The Transportation Average was first published on July 3, 1884, and consisted of nine railroads. The index has since evolved to include a broader range of transportation companies.
In India, Our economy does not have private railroad companies. But We have Banks. Our economic growth is directly linked with Banks. So, in our version of Dow Theory, the BANK NIFTY index bags the same significance.
3. Trends have three phases –
- The third tenet of Dow Theory states that trends have three phases – accumulation, public participation, and distribution.
- In the accumulation phase, smart money enters the market and begins buying shares.
- In the public participation phase, the general public begins to participate in the trend, driving prices higher.
- In the distribution phase, smart money begins to sell shares to the public, leading to a decline in prices.
It is quite interesting to see how Price Action and Dow Theory is already demystifying the scam.
Q: When a reputed Mutual Fund gives a recommendation, retail investors tend to buy the stock. But, Why it mostly falls after some time of the event?
A: Unfortunately, while retail investors buy, DIIs start dumping, making a joke out of retail investors. This is the very example of third tenet of the Dow Theory only.
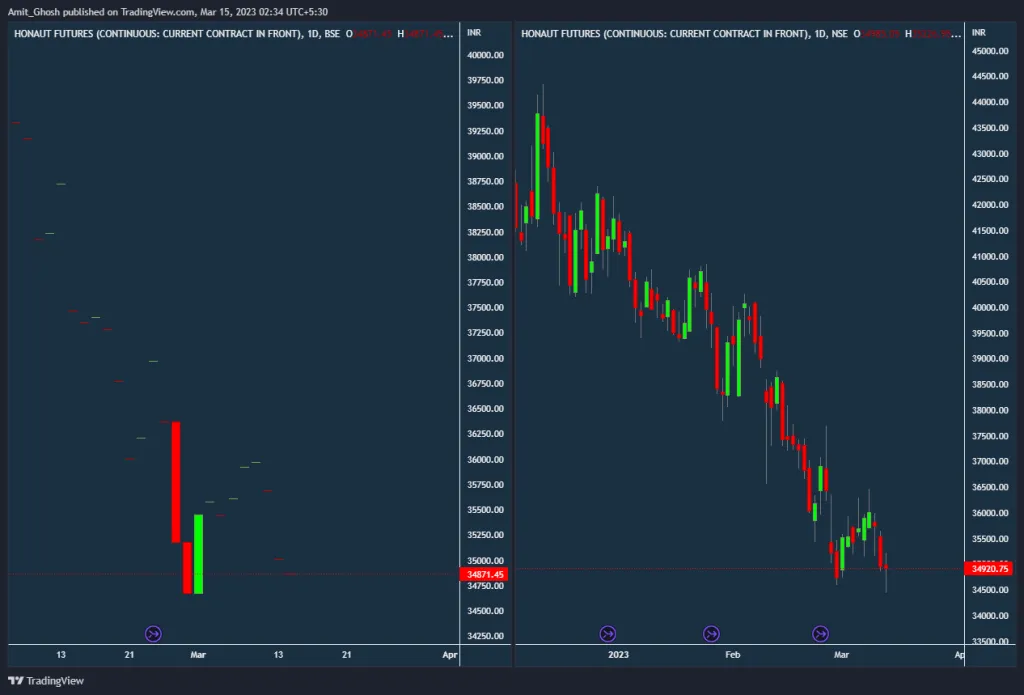
What is good liquidity in terms of Price Action?
Good liquidity in terms of price action refers to a market condition where there is sufficient trading volume and activity, allowing for smooth and efficient price movements. In a liquid market, buyers and sellers can easily execute trades without significantly impacting the market price, and the bid-ask spread is typically narrow.
It depends on the exchange.
Here is an example of Honeywell Automation India Limited’s derivatives in BSE (Left Side) and NSE (Right Side). NSE is more popular among derivatives trades compared to BSE.
It depends on the timeframe.
The liquidity of a market can vary depending on the time frame being analyzed. For example, a stock that may appear to be illiquid when viewed on a lower time frame, such as a 5-minute chart, may appear more liquid on a higher time frame, such as a daily or weekly chart. This is because a lower time frame chart may not capture all of the trading activity that occurs over the course of a day, and therefore may not accurately represent the liquidity of the stock.
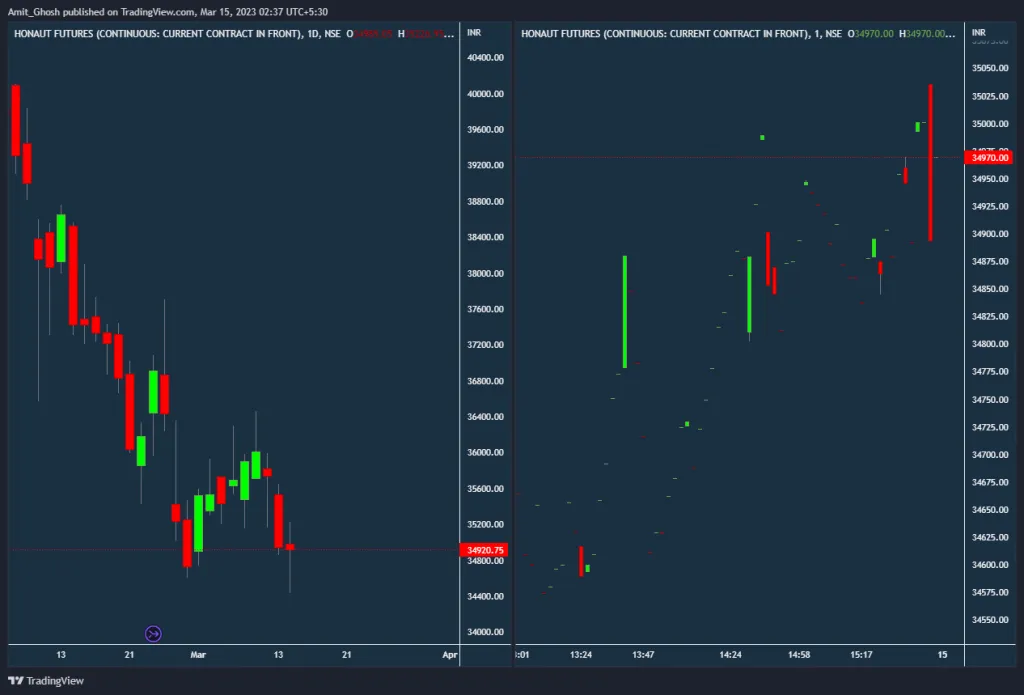
Here is an example of Honeywell Automation India Limited’s derivatives in a daily and 1-minute timeframe.
The low trading volume and liquidity of the stock in a 1-minute time frame make intraday trading difficult or risky. This is because low liquidity can result in wider bid-ask spreads, slippage, and difficulty in executing trades, which can increase transaction costs and reduce profitability.
In general, it may be more appropriate to focus on longer time frames, such as daily or weekly charts, when trading stocks with low liquidity.
How to identify good liquidity scripts?
1. Average Daily Trading Volume: A good liquidity script should have a high average daily trading volume, which indicates the number of shares that are being traded each day.
2. Bid-Ask Spread: A narrow bid-ask spread indicates that there is enough liquidity in the market, as there are many buyers and sellers available.
3. Market Capitalization: A high market capitalization indicates that a company has a large number of shares outstanding, which means that there is a higher chance of finding a buyer or seller for the shares.
Keep in mind that the liquidity of a script can vary depending on market conditions, news events, and other factors. Like, The bank stocks become highly active at the end hour of the expiry day.
Expiry Day
- In trading, expiry day refers to the last day of trading for a derivative contract, such as options or futures contracts. On this day, traders and investors have to either settle their position or roll over their contract to the next expiry date.
- If a trader fails to settle their position by the expiry day, it will result in automatic square-off of the position by the exchange.
- Expiry day can be a crucial day for traders and investors, as it can lead to increased volatility and price movements in the underlying asset.