Trend Lines

In this chapter, you will learn –
- What a trend line is,
- The correct way to draw them and
- How you can trade using trend lines.
Trend lines are useful for structuring price action.
They can be used to help identify the current trend or help confirm a reversal of the current trend.
- If the price is under the trend line, then the overall direction is down.
- If the price is above the trend line, then the overall direction is up.
When the price breaks through the trend line, it is likely that the price is now reversing direction.
- Trend lines in a down trend are drawn by connecting at least two highs with a line,
- and trend lines in an up trend are drawn by connecting two lows with a line.
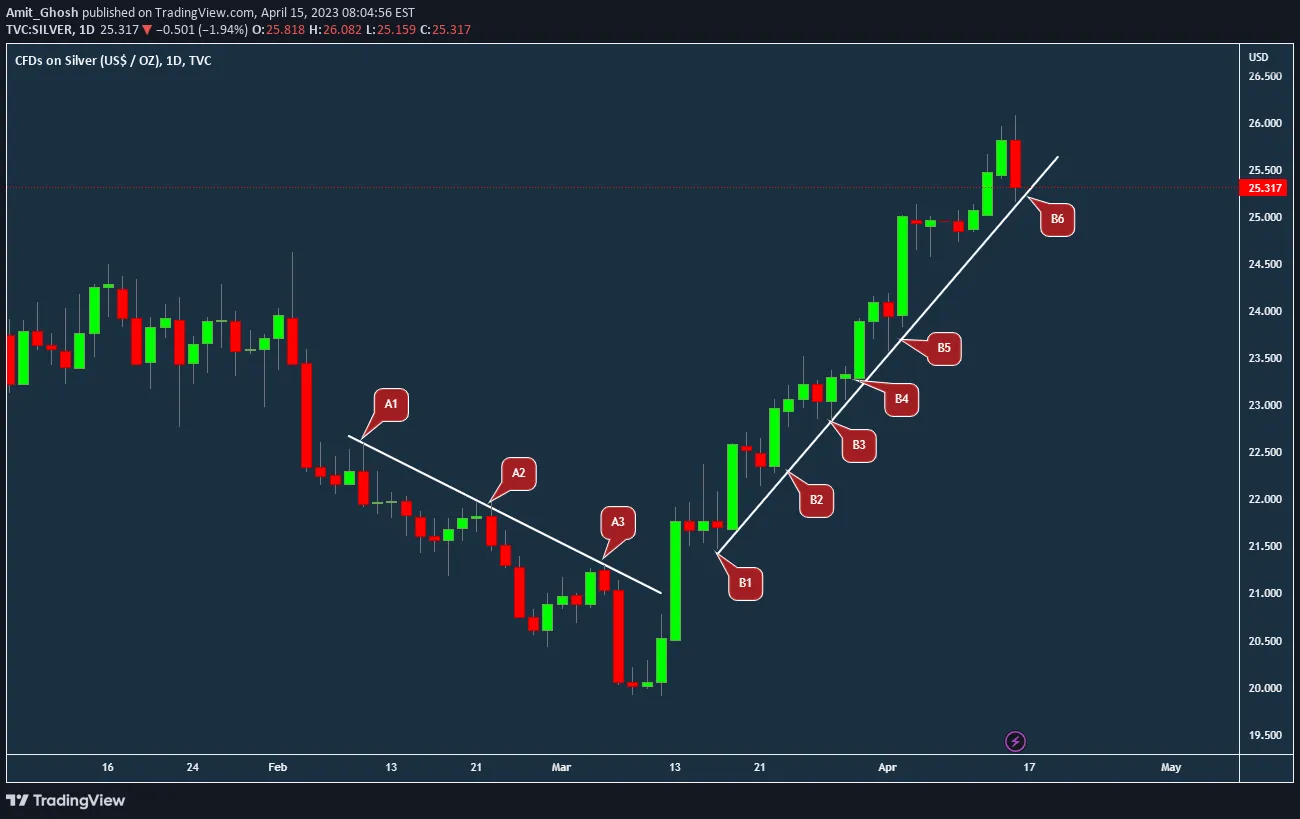
- The more times price touches the trend line, the more valid it is.
- It is not necessary that all candles are below or above the trendline, as long as the vast majority are.
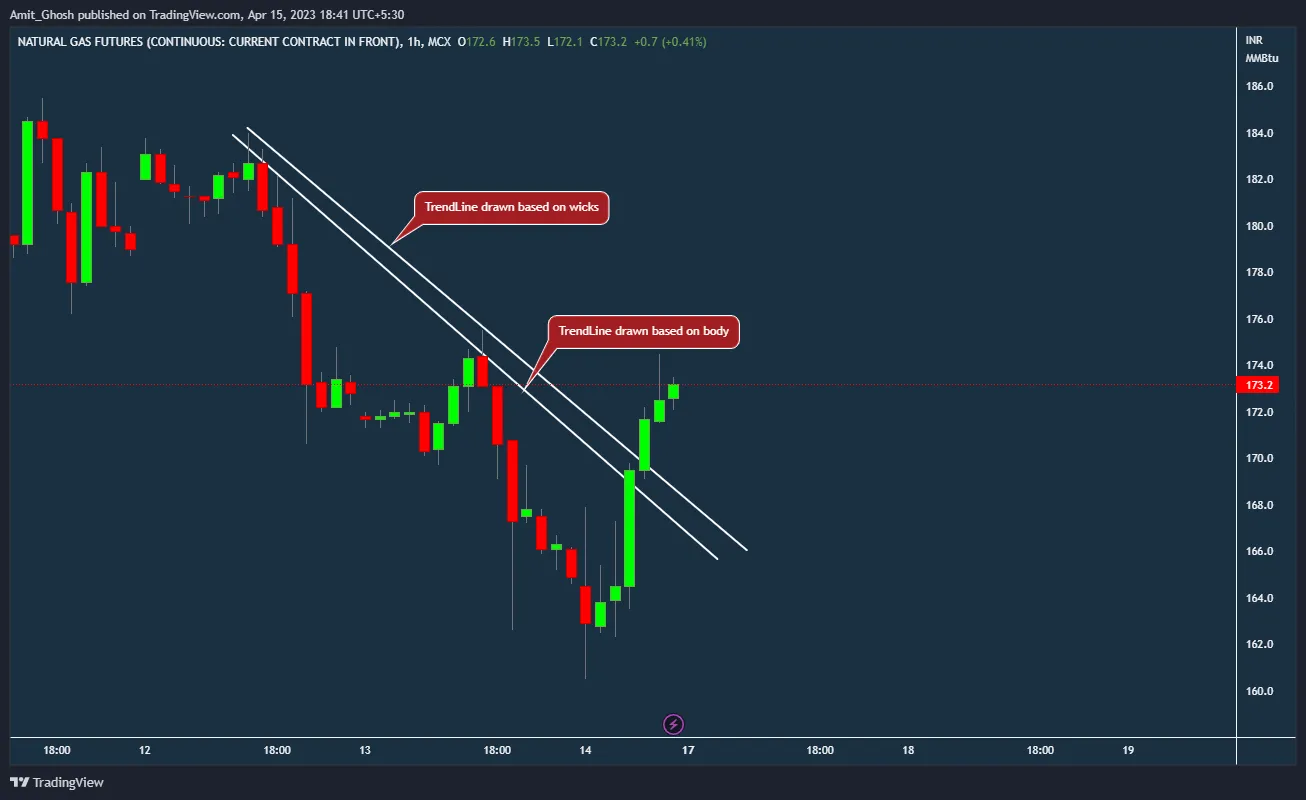
Furthermore, just as with the support and resistance lines, you can choose whether you use the bodies of the candles or their wicks as the basis of trendlines.
There is no right or wrong, it just depends on what works best for you.
Bounce or Break
Trendline can be traded in two ways. Either by entering when the price finds support or resistance at the trend line, or when the price breaks through the trend line.
Uptrend
In this case, we are going to observe both ways to trade using trend lines in an uptrend.
First of all, you can trade the bounce of a trend line. This means that whenever the price touches the trend line and finds support, you can place a trade in the direction of the trend. Since this is an uptrend, you go long when the price touches the trend line. Your stoploss will go on the other side of the trend line.
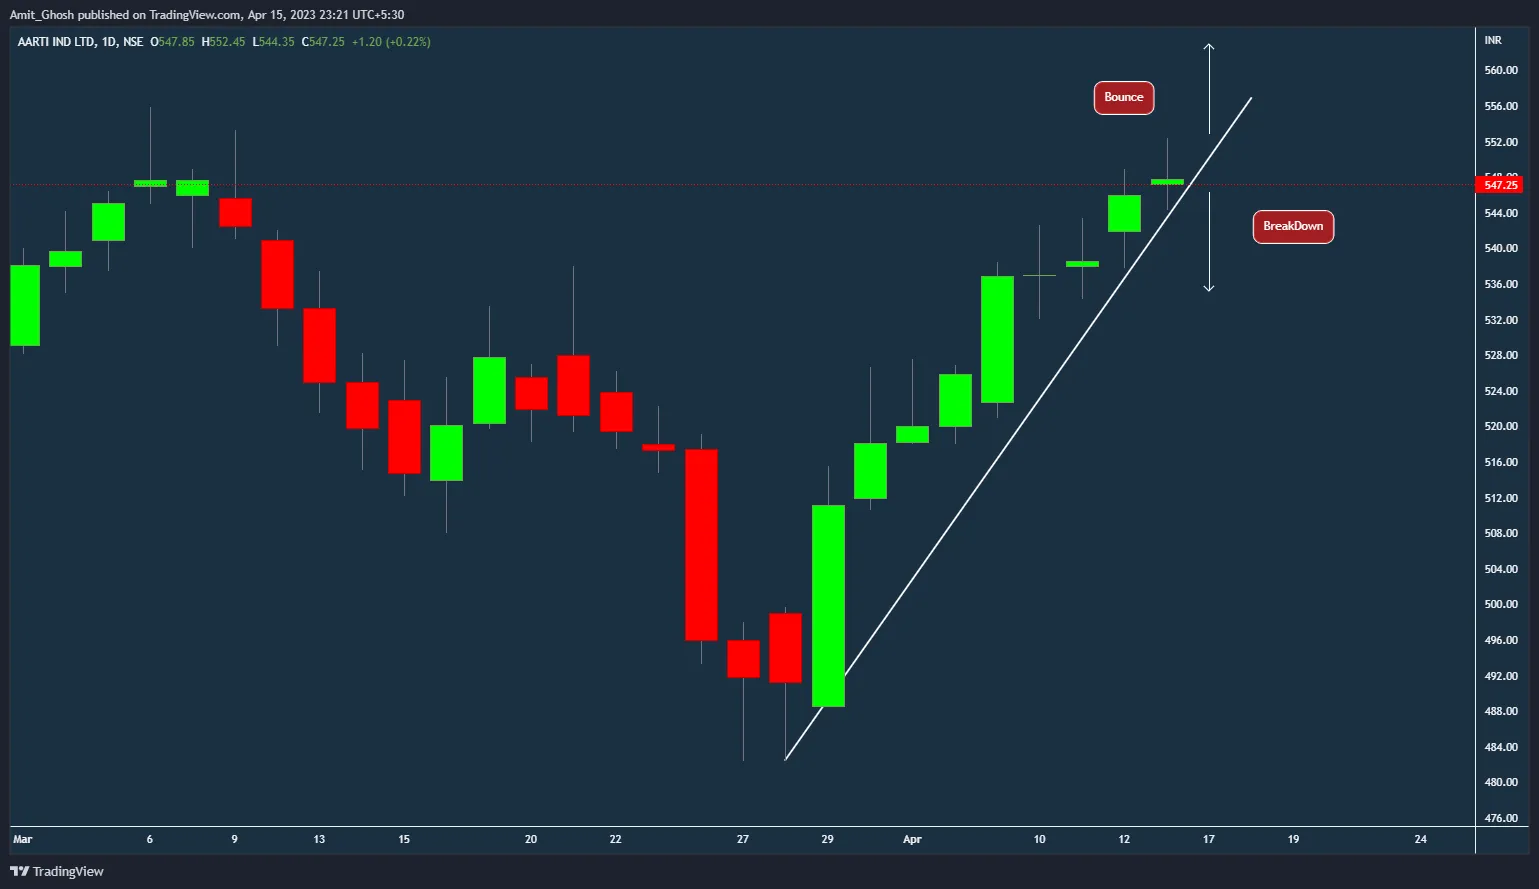
You can also wait for price to break through the trend line and trade the breakdown. In this case, you wait for the price to break through the trend line and go short.
Downtrend
You can use trend lines in the same way when the price is in a downtrend. Whenever price touches the trend line and finds resistance, you can place a trade in the direction of the trend. In this case, Let’s take a short position as the trend is down. Your stop loss would go on the other side of the trend line.
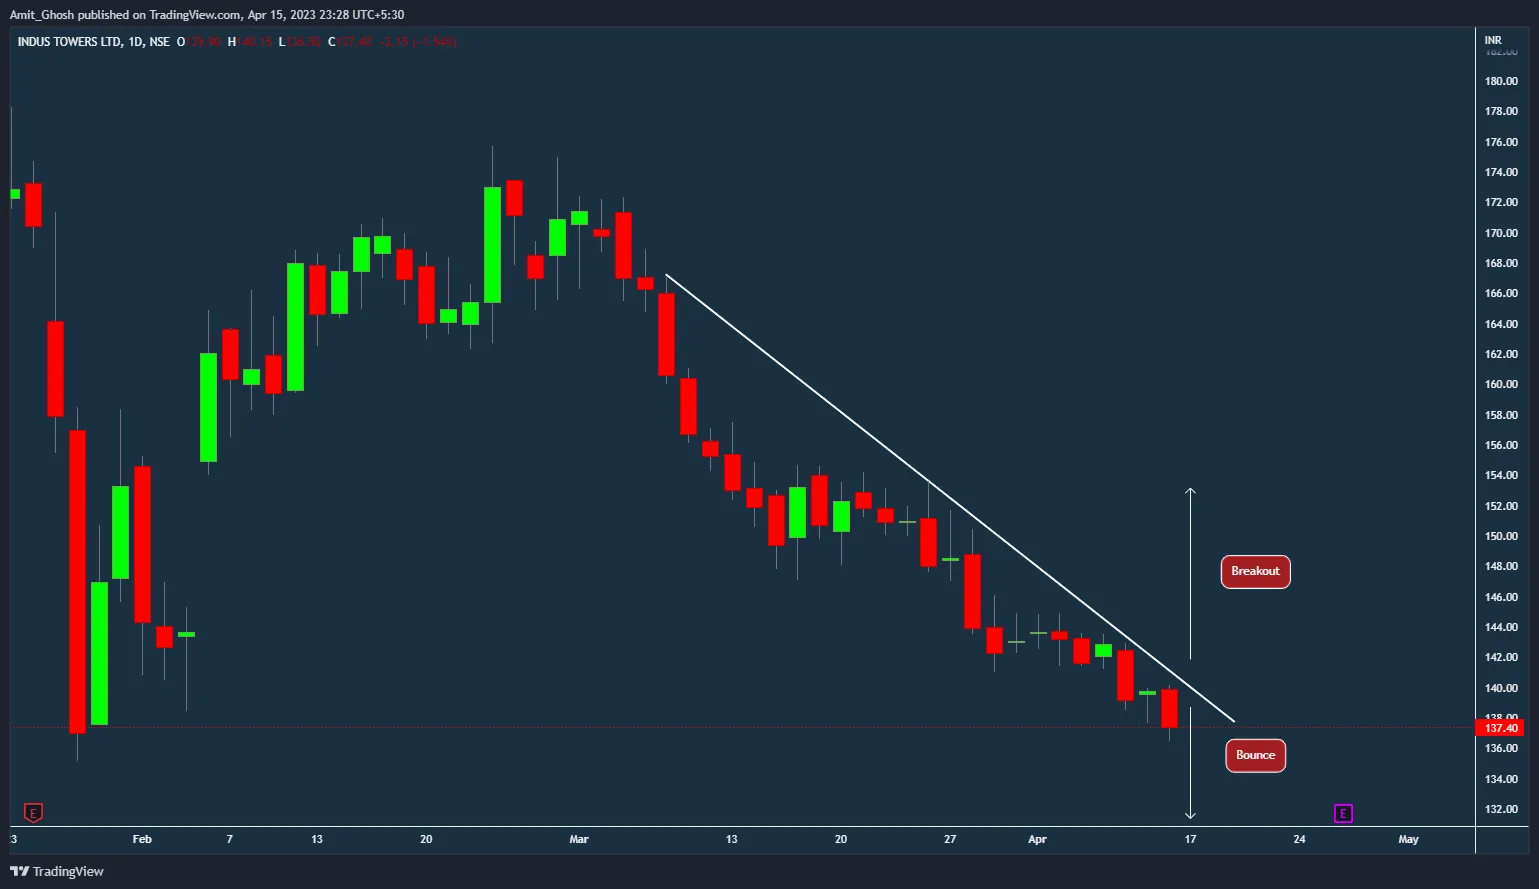
Or you can also wait for the price to break through the trend line and trade the breakout. In this case you wait for the price to break through the trend line and go long. Again, you put your stop loss on the other side of the trend line.
False Breakouts/Breakdowns
Retest of Trendlines
To prevent you from entering on a false breakout, wait until price closes below the trend line and comes back to retest the trend line from the other side.
When the price does not cross the line again and continues moving down, it means it successfully tested the trend line and confirmed that the breakout is not false. You can then enter into a short position.
This concludes the discussion on trading with trend lines . So far you have learned that –
- Trend lines are support or resistant lines drawn at an angle.
- They are used to show the current market sentiment and find entry points for trades.
- To draw a trend line in a downtrend, two highs must be connected by a straight line.
- To draw a trend line in an uptrend, two lows must be connected by a straight line.
- Furthermore, you saw that the more often price touches the trend line, the more valid the trend line becomes.
- And you also learned that you can trade the bounce and the breakout or breakdown.