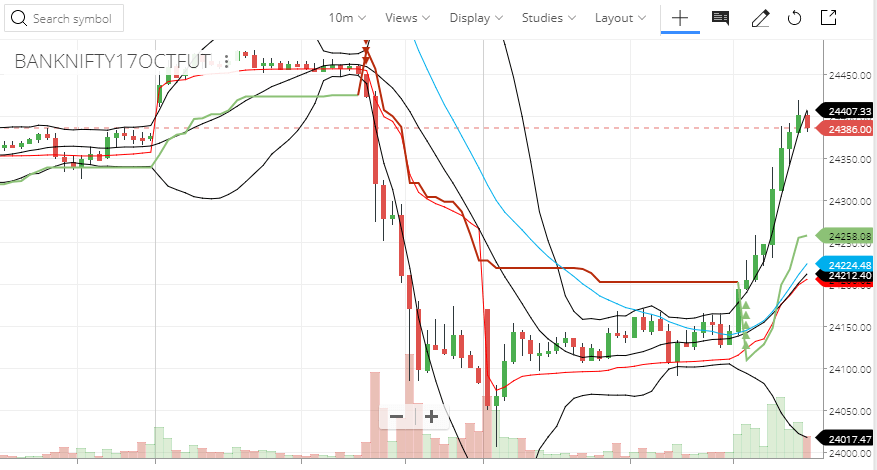
The discussion happened on yesterday live market on #nse_entropy channel in our forum.

Firstly the discussion started on Entropy; it was about combining the Bollinger bands with support and resistance and candlesticks.
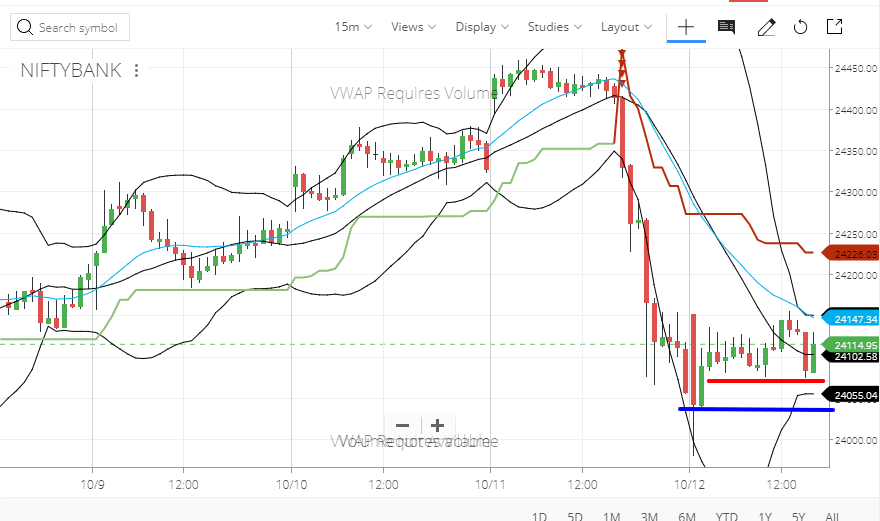
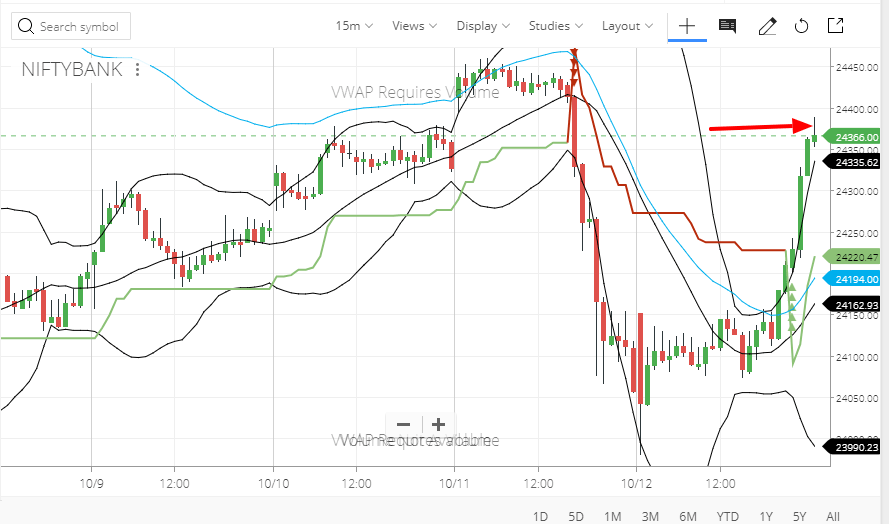
Buy Bank NIFTY futures on the red line with a stop loss at the blue line. Rationale –
Bollinger Bands
It is getting squeezed telling that a major move is coming. Now which side it should be ? or it will be an ongoing consolidation?
DMA
- Moving average with double exponential is used by all day traders from Dallal street and it is basically people with big money!
- So if DMA is crossed; we can witness huge upside, but it will repel the DMA. So that’s why it is acting as sell on the rise and entering into consolidation.
Support
24000 is major support. Results week ahead. It showed pin bar formation showing heavy buying many times there. Global markets are up; we just have undergone another correction.
I never discussed the Bollinger squeeze scenario. Now witness it.
Q. Why are we using super trend?
A. I will tell in time. I am combining Bollinger bands with candlesticks. It will increase the win ratio.
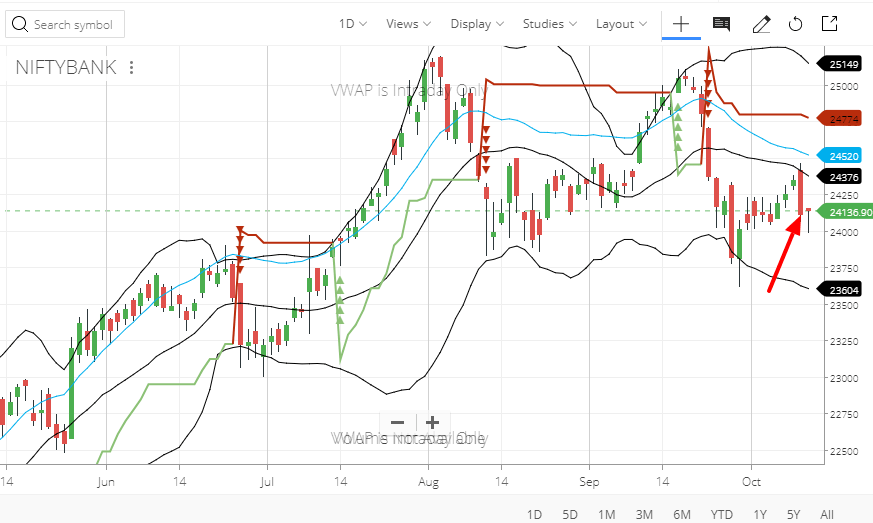
It about to trigger !!! Now it is very near to the DMA.
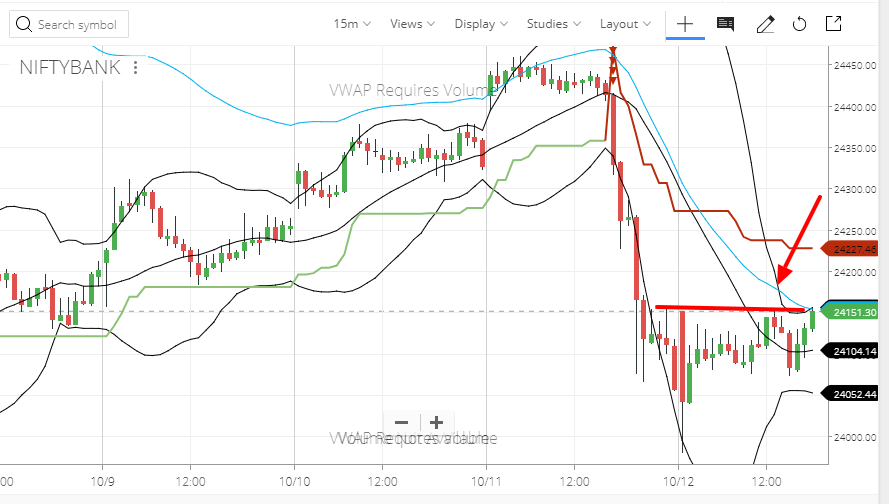
The blue line i.e DMA is ultra high chance of reversal but once confidently broke it will be amazing! Meanwhile, I am in the trade already – ![]()
Apart from naked future trade here is another weird idea –

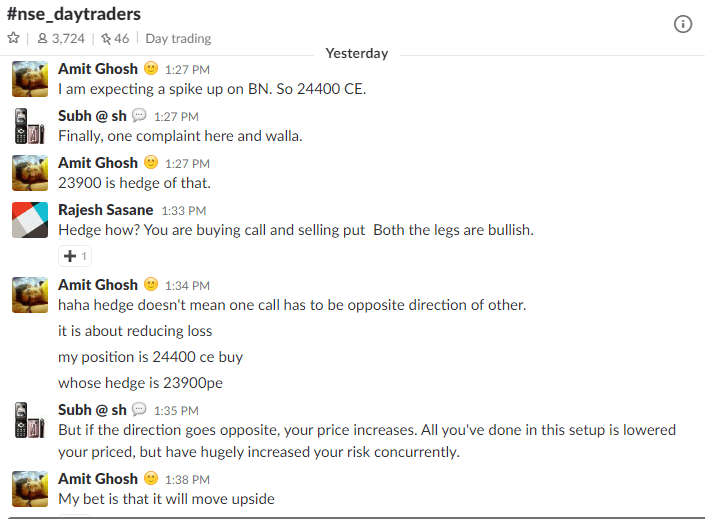
Weird Idea is Sell 23900 PE and Buy 24400 CE. I am expecting a spike up on BN. So 24400 CE.
Q. How to interpret squeezing of Bollinger bands to be up or down and also how to interpret if that upmove or downmove is going to follow?
A. BB Squeeze tells that a huge move is coming! Other indicators indicate which side it is going to be. It needs experience. ! Trust me if you manage to stay in this group for 1-2 year; trust me you will be a trader anyways. 50% of “traders/investors” don’t know what does Bank nifty 24500 PE means.
Entropy 3bb works on BB expansion. Entropy BRS works better on BB squeeze. Let’s take TCS – 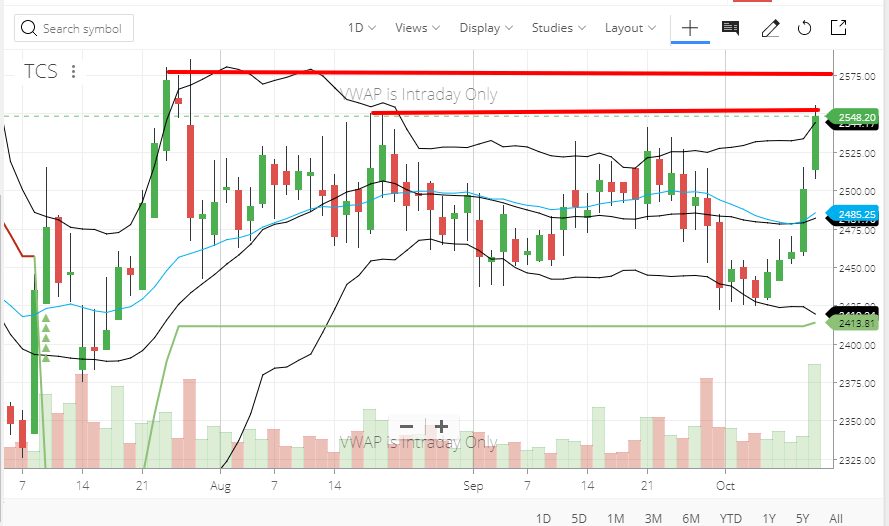
Whenever you trade something first check their daily charts. Its near resistance 1 but can break it easily. The main resistance is the upper red line. Then track fundamentals! TCS has its results today! Then come to 15m.
There are two parts now. I am certain you’re not fast as me; so if you try to scalp for 1-10 points; you will be fucked once because you won’t close when stop loss hits.
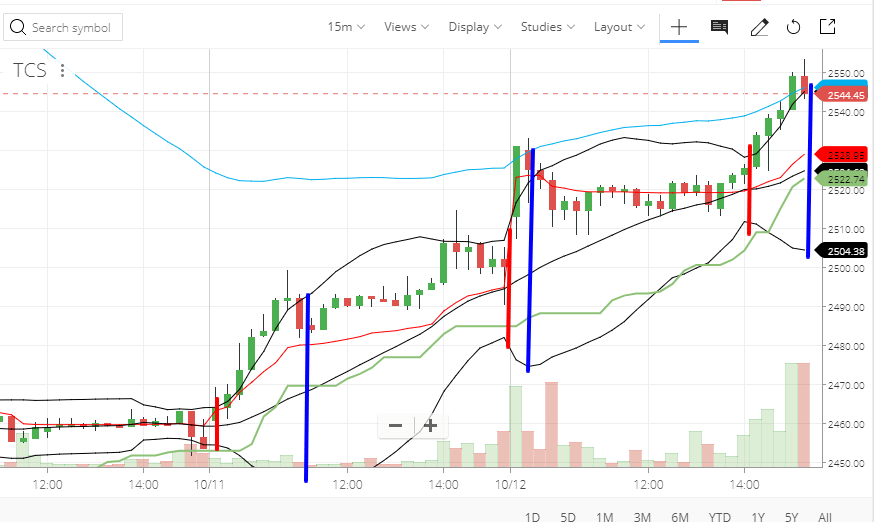
Did you notice I made three red lines and three blue lines?
- Three red lines are BB squeeze.
- Three blue lines are BB expansion.
Now the above blue line which is coming from the moon (look upper left corner) is 50 DMA. Cross that line confidently (low of a green confirmed candle above that line is confident crossing) means TCS will shoot to the moon. But otherwise, it is resistance!
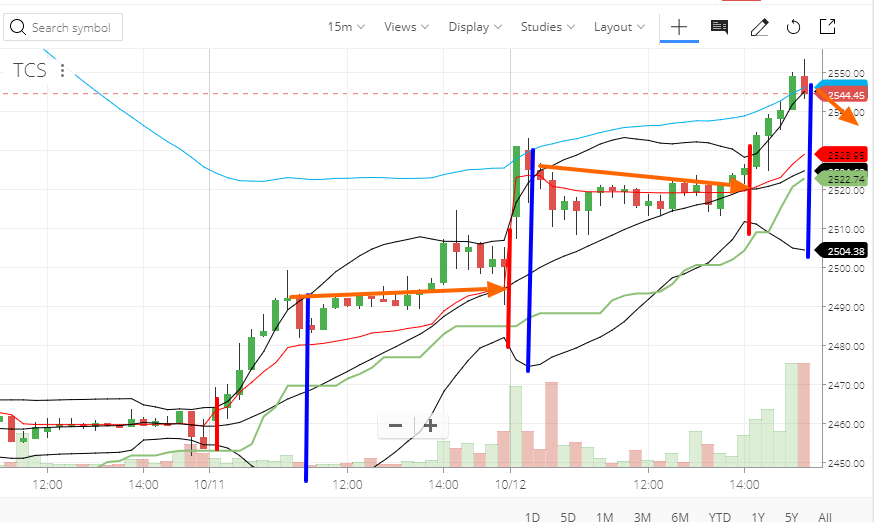
The orange lines! You need to combine your skills of candlesticks where the only fact you need to know are wicks!! Long tails!
Here is a trading idea for tomorrow –
This is at BB expansion. The candle bodies are reducing telling that bulls are not coming more! You can short it with stop-loss at the head. Low-risk high reward strategy!
But the high chance market can open the gap up. Tomorrow will be a volatile day! (Not volatile as today though)!
Update:
 Bank NIFTY Oct Futures closed at 24382 making us a massive gain! Our options trades made a massive gain too!
Also as discussed in the market overview of today, FII did not pull money but dumped more money along with DIIs.
