What is Price Action

In the universe of technical analysis, Price Action is the sun around which all other concepts orbit. It is the raw, unadulterated language of the market, reflecting the sum total of all buying and selling decisions made by every participant. For a trader, learning to read Price Action is like learning the grammar of the market itself. It is the foundational skill upon which robust trading strategies are built.
This lesson decodes the concept of Price Action, moving from its theoretical basis to its practical application on the charts of the National Stock Exchange (NSE).
The Essence of Price Action
At its core, Price Action is the study of a security’s price movements over time. It is a form of technical analysis that focuses exclusively on the Open, High, Low, and Close (OHLC) data, without the direct use of secondary indicators derived from them. The foundational belief is that all fundamental data, news, and market sentiment are already “priced in” and are reflected in the way the price moves.
A price action trader operates on a clean chart. The analysis is not cluttered with multiple oscillators or moving averages. The primary tools are an understanding of market structure, candlestick patterns, and support/resistance levels.
Key Components of Price Action Analysis
To analyze price action is to understand its constituent parts:
- Candlestick Patterns: Each candlestick tells a story of the battle between bulls and bears over a specific period. Patterns like the Doji, Hammer, or Engulfing patterns can signal indecision, reversals, or continuation of a trend.
- Market Structure: This refers to the way swing highs and swing lows form in sequence. An uptrend is defined by a series of Higher Highs (HH) and Higher Lows (HL). A downtrend is marked by a series of Lower Highs (LH) and Lower Lows (LL). A sideways market shows no clear pattern of highs and lows.
- Support and Resistance: These are horizontal price zones where the market has previously reversed direction. Support is a price floor where buying pressure tends to overcome selling pressure. Resistance is a price ceiling where selling pressure tends to overcome buying pressure.
Price Action Strategies: From Theory to Trade
A strategy built on Price Action uses these core components to identify high-probability trade setups. The goal is to enter the market at a logical point where risk is defined and the potential for reward is favourable.
Identifying Swing Lows and Swing Highs
Swing points are the turning points in the market. A swing high is a peak before a downward move, and a swing low is a trough before an upward move. While you can identify these without charts, candlestick charts make the process vastly simpler and more objective. These points are the building blocks of trend analysis and are critical for placing stop-loss orders.
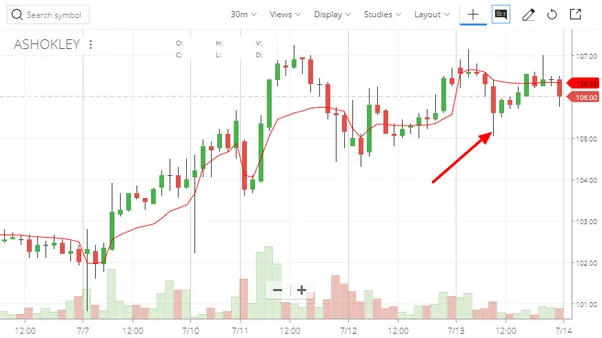
The chart above of Ashok Leyland shows a clear uptrend marked by a sequence of higher lows and higher highs. Each swing low provides a potential entry point for a long trade or a logical level to place a trailing stop-loss.
Triggers, Breakouts, and Stop-Loss Cascades
In price action terminology, a “trigger point” is a specific price level which, if breached, is expected to initiate a significant move. This is often the high or low of a key candlestick.
For example, a candle with a very long upper wick indicates that sellers overpowered buyers at the session high. A trader might note, “Crossing the high of this candle will trigger price action.” This implies that a move above this wick high would invalidate the selling pressure seen earlier and could lead to a sharp rally, as it would force those sellers to cover their positions.
These trigger points are also where many stop-loss orders congregate. When price breaches a well-defined support or resistance level, it can trigger a cascade of stop-loss orders. If a key support level breaks, long positions get stopped out, adding to the selling pressure and accelerating the downward move. A savvy price action trader aims to position themselves to ride this momentum.
Price Action vs. Indicators
A frequent point of confusion is the relationship between price action and technical indicators. Are they mutually exclusive? Not necessarily, but their roles are distinct.
Most indicators, like the Relative Strength Index (RSI) or Moving Average Convergence Divergence (MACD), are derivatives of price. They process raw price data through a mathematical formula to provide a different perspective. They are lagging by nature.
Some tools, however, are considered pure Price Action indicators because they are built directly from historical price data without complex transformation. Bollinger Bands are a prime example. The bands are plotted at a standard deviation level above and below a simple moving average of the price. Their expansion and contraction are direct representations of price volatility.
In contrast, an indicator like Volume Profile is not a pure price action tool. It incorporates an additional data dimension—trading volume—and plots it against price levels. While immensely useful, it goes beyond the simple analysis of OHLC data.
Risk Management in a Price Action Framework
One of the greatest strengths of price action trading is that it provides clear, logical levels for risk management.
Setting Stop-Loss Levels
Your stop-loss is your invalidation point. It is the price at which your trade thesis is proven wrong. Price action provides objective locations for this.
- For a long trade, the stop-loss is typically placed just below the most recent significant swing low or below the low of the signal candle.
- For a short trade, the stop-loss is placed just above the most recent significant swing high or above the high of the signal candle.
This method ensures your risk is defined by the market’s own structure, not by an arbitrary monetary value or percentage.
Calculating Position Size with R-Multiple
Once you have an entry point (E) and a stop-loss (SL), you have defined your initial risk (R) per share.
For a long trade:
This R-value is the cornerstone of professional risk management. Your profit targets should be expressed as a multiple of R. A target of 2R means you are aiming to make twice your initial risk.
The R-Multiple of a trade is calculated as:
A trader should only take trades that offer a favourable R-multiple, typically 1.5R or greater. This ensures that even with a win rate below 50%, the trading system can remain profitable over the long run. Price action helps identify setups where this asymmetry between reward and risk is present.