Theory of Open Interest

“Open interest is like a puzzle – it may seem confusing at first, but once you put the pieces together, you can see the bigger picture of the market.”
Both volume and open interest are relatively useless on their own. Volume today doesn’t predict tomorrow’s volume, but open interest can. Unlike volume, changes in open interest don’t indicate market direction. Open interest does show a balance of bullish and bearish positions.
Interpreting Price and Volume
Before We discuss Open Interest, We need to talk about the relationship between price and volume. Here are the four possible combinations of price and volume:
Price Up, Volume Up:
- When the price is rising, and volume is increasing, it is usually a sign of a strong bullish trend.
- This indicates that there are more buyers than sellers in the market, and traders are willing to pay higher prices for the asset.
- This is a good time to go long on the asset.
Price Up, Volume Down:
- When the price is rising, and volume is decreasing, it could be a sign of weakness in the market.
- This could be due to a lack of conviction among buyers or a decrease in the number of traders participating in the market.
- This situation calls for caution, and traders should be wary of long positions.
Price Down, Volume Up:
- When the price is falling, and volume is increasing, it is usually a sign of a strong bearish trend.
- This indicates that there are more sellers than buyers in the market, and traders are willing to sell at lower prices.
- This is a good time to go short on the asset.
Price Down, Volume Down:
- When the price is falling, and volume is decreasing, it could be a sign of consolidation or lack of interest in the market.
- This could be due to traders waiting for a significant event or a lack of significant news in the market.
- This situation calls for patience, and traders should wait for a clear direction to emerge before entering a position.
Table 1: Relation Between Price And Volume
Price | Volume | Open Interest Theory |
Increase | Increase | Bullish |
Decrease | Decrease | Bullish pressure is decreasing. |
Decrease | Increase | Bearish |
Increase | Decrease | Bearish pressure is decreasing. |
These four combinations of price and volume should be used in conjunction with other technical analysis tools to make informed trading decisions.
Interpreting Open Interest
Interpreting open interest data in conjunction with price can give traders important insights into market sentiment and potential trends. This assumption collectively is known as “The Open Interest Theory”. There are four possible scenarios to consider when analyzing open interest and price movements:
Rise in prices and rise in open interest:
- This indicates a Long Buildup, which means that traders are taking long positions in the market, indicating bullish sentiment.
- If the increase in open interest is substantial, it suggests that the trend is likely to continue.
Rise in prices and fall in open interest:
- This indicates that the rise in price is not backed by a significant increase in new positions, and therefore may not be sustainable.
- It could also indicate Short Covering, where traders who were previously short in the market are buying back their positions to exit the trade, leading to a temporary price increase.
Fall in prices and fall in open interest:
- This indicates Long Covering, where traders who had previously taken long positions are exiting the market, indicating bearish sentiment.
- If the decrease in open interest is significant, it suggests that the trend is likely to continue.
Fall in prices and rise in open interest:
- This indicates a Short Buildup, where traders are taking short positions in the market, indicating bearish sentiment.
- If the increase in open interest is substantial, it suggests that the trend is likely to continue.
Table 2: Relation Between Price And OI (Open Interest)
| Price | OI | Interpretation |
| Increase | Increase | Long Buildup |
| Decrease | Decrease | Long Covering |
| Decrease | Increase | Short Buildup |
| Increase | Decrease | Short Covering |
Cases where Open Interest and Volume may not be effective
While open interest and volume are useful indicators in many cases, they may not always provide an accurate picture of market activity. Here are a few examples of situations where these indicators may not be effective:
- Lack of liquidity:
- In thinly traded markets, such as some options and futures contracts, open interest may be low, making it challenging to draw accurate conclusions about market activity.
- During low-volume periods, such as holidays or weekends, the volume may be very low, making it difficult to determine market direction accurately.
- Unusual market events: Unforeseen market events such as natural disasters, political instability, and pandemics can distort open interest readings. Be cautious if there is abnormally high OI with rapid increase/decrease in prices as it indicates euphoria and leverage in the market. A small trigger could lead to panic.
- Misleading signals: Open interest can sometimes produce misleading signals when prices fluctuate rapidly, resulting in a lack of correlation between the two.
Re-Interpreting Open Interest in terms of Psychology
The stock market is not only about numbers and financials, but it is also a psychology play. The behavior and emotions of traders and investors can significantly impact stock prices. The market is driven by fear, greed, optimism, pessimism, and other psychological factors.
Open interest is a useful tool to gauge herd mentality in the market.
- Open interest provides data on the number of market participants who hold a particular position, which in turn can reflect the herd mentality of traders.
- Many traders tend to follow the crowd and make trades based on what others are doing, rather than analyzing the underlying fundamentals.
- A sudden surge or decline in open interest can signal a shift in the market’s psychology, which can affect prices.
So, Let’s re-discuss the old interpretation again in light of this new context:
Bullish/Bearish Sentiment:
- A rise in open interest suggests that market participants are increasingly bullish or bearish on the asset.
- This can indicate a sense of optimism or pessimism about the asset’s future price movement.
- When open interest rises and prices remain stable or move in a specific direction, it can indicate that traders are building up long or short positions.
- This shows the confidence and conviction of the traders towards their positions.
- When open interest falls and prices rise, it can indicate that traders are covering their short positions or taking profits on their long positions.
- This suggests that market participants are unsure about the asset’s future price movement and are taking a cautious approach.
- Abnormally high open interest backed by a rapid increase or decrease in prices can suggest that there is a lot of euphoria and leverage being built up in the market.
- In such situations, even a small trigger could lead to panic in the market.
Re-Interpreting Open Interest in terms of Options Trading
Let’s take a quick glance at all the jargon in a table format, shall we? While it may seem unnecessary to reiterate the same information, it is crucial to have clarity when dealing with complex concepts.
Confusion can easily arise later on, so it’s better to communicate ideas and jargon clearly from the beginning.
Call Options:
With respect to call options, the four cases are:
- Call Long Buildup: When traders are buying more call options contracts than they are selling, and open interest in call options is increasing, it indicates that the traders are bullish on the underlying asset’s future price movements.
- Call Short Buildup: When traders are selling more call options contracts than they are buying, and open interest in call options is increasing, it indicates that the traders are bearish on the underlying asset’s future price movements.
- Call Short Covering: When traders who have sold call options buy them back, and open interest in call options is decreasing, it indicates that the traders are closing their bearish positions, possibly due to an expectation of a rise in the underlying asset’s price.
- Call Long Covering: When traders who have bought call options sell them, and open interest in call options is decreasing, it indicates that the traders are closing their bullish positions, possibly due to an expectation of a fall in the underlying asset’s price.
- Interpretation
Interpretation | CE | OI |
Call Long Buildup | Increase | Increase |
Call Short Buildup | Decrease | Increase |
Call Short Covering | Increase | Decrease |
Call Long Covering | Decrease | Decrease |
Put Options:
With respect to put options, the same four cases apply, but the interpretation is opposite to that of call options:
- Put Long Buildup: When traders are buying more put options contracts than they are selling, and open interest in put options is increasing, it indicates that the traders are bearish on the underlying asset’s future price movements.
- Put Short Buildup: When traders are selling more put options contracts than they are buying, and open interest in put options is increasing, it indicates that the traders are bullish on the underlying asset’s future price movements.
- Put Short Covering: When traders who have sold put options buy them back, and open interest in put options is decreasing, it indicates that the traders are closing their bullish positions, possibly due to an expectation of a fall in the underlying asset’s price.
- Put Long Covering: When traders who have bought put options sell them, and open interest in put options is decreasing, it indicates that the traders are closing their bearish positions, possibly due to an expectation of a rise in the underlying asset’s price.
| Interpretation | CE | OI |
| Put Long Buildup | Increase | Increase |
| Put Short Buildup | Decrease | Increase |
| Put Short Covering | Increase | Decrease |
| Put Long Covering | Decrease | Decrease |
Now, Let’s look at the scanner made on the website of Unofficed.com for a real-life example –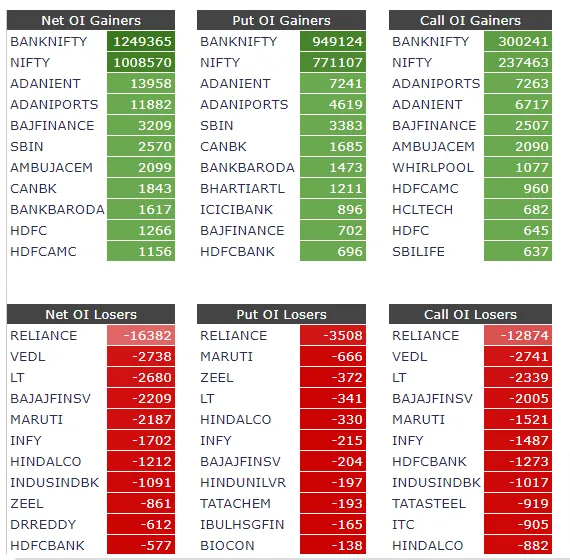
If we just take the separate examples of Call Options and Put Options, the interpretation looks easy.
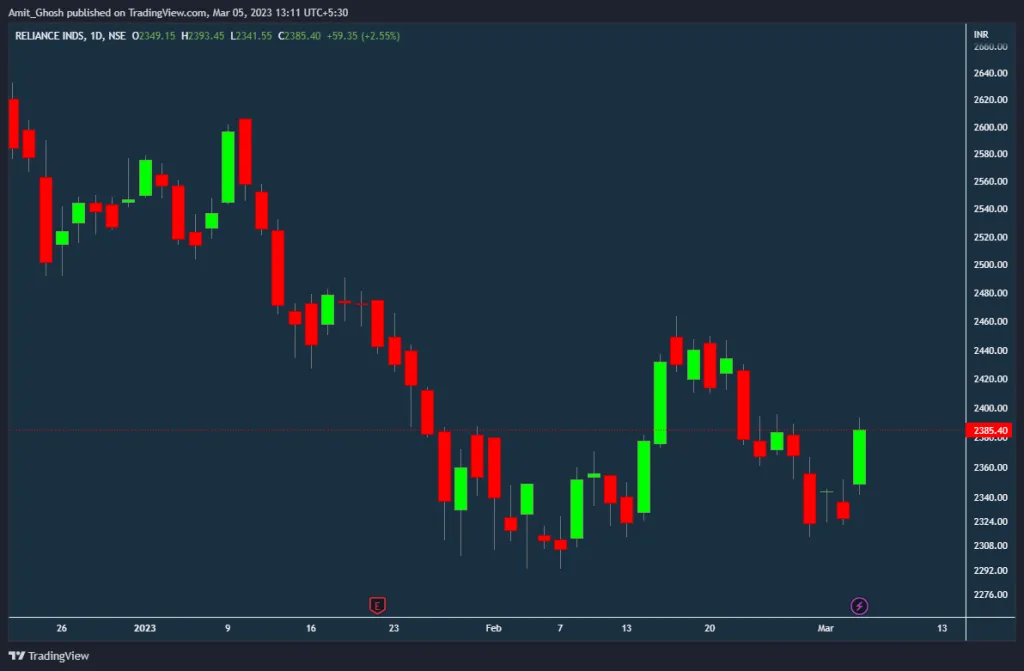
As in this case, there is a Loss in Put OI in Reliance. Now, We need to check the price of the underlying i.e Reliance. As we can see from the Tradingview snapshot of the Daily Timeframe of Reliance, Reliance ended up in green. It means the Price increased.
So “Price Increase + OI Decrease” means Short Covering.
But, Call Options have their Open Interest reduced as well. So, We have both “Put Short Covering” and “Call Short Covering”.
In other words, if a trader only focuses on “Put Short Covering” and ignores the interpretation of Call Open Interest, they may not have as much of an advantage as a trader who considers both factors.
Do you agree?