“Open Interest is the silent partner in the support and resistance relationship – it’s not always obvious, but it’s always there, quietly influencing the market.”
Let’s recap all the concepts –
Open Interest is a powerful tool that can help traders identify potential support and resistance levels in the market. In this chapter, we will explore the concept of support and resistance, how to use Open Interest to identify these levels, and how to incorporate this information into your trading strategy.
Support and resistance levels are areas on the price chart where the market has previously struggled to move above or below. These levels can act as barriers to price movement, with support preventing prices from falling further and resistance preventing prices from rising further.
Support
Support is like a lifeline for a stock price, a level on a chart where it has a hard time breaking down. This is where the buyers tend to come in and start buying, which creates demand and supports the price.
When a stock falls to this level, it has two options:
- First, it can “bounce” off of the support level and start to climb up again.
- Second, it can break through the support level and continue to fall until it finds another level of support.
The more times a stock bounces off a support level, the stronger that level becomes. It means that more buyers are stepping in at that price level, creating a stronger demand and support.
Remember, support is not a guarantee that the stock price will always bounce back up. It is a level where the stock has historically had support in the past. Sometimes, stocks can break through support levels and keep falling, but it’s still a crucial indicator to keep an eye on while making trading decisions.
Resistance
In the exciting world of trading, resistance is a formidable opponent to the stock price. Resistance levels are the historical price points that the stock has struggled to surpass, creating a ceiling that stops the stock from going any higher.
Just like support levels, there are two ways that stocks test resistance areas. The stock will either try to rise above the resistance level and then “bounce” off of it, causing the stock to drop in price, or it will break through the resistance level and continue to rise.
Resistance levels are created when there is a higher volume of sellers than buyers in the market, which causes the rally in stock price to halt. These levels are significant because they help traders understand where selling pressure is high and where the stock is likely to reverse course.
When a stock reaches a resistance level, traders who believe the stock has reached its peak will start selling, causing the stock to fall in price. If the resistance level is no longer significant, the stock may break through it and continue to rise.
Open Interest and Support and Resistance
Open Interest is a measure of the number of outstanding contracts in the market. A significant increase or decrease in Open Interest can indicate the potential for a strong trend, with high Open Interest levels corresponding to areas of potential support and resistance.
To use Open Interest to identify potential support and resistance levels, start by looking for areas of significant Open Interest. Then, identify the corresponding price levels where the market has previously struggled to move above or below. These levels can serve as potential support and resistance levels.
Summarizing –
- Open Interest (OI) is an important indicator for support and resistance in derivatives.
- OI indicates the number of outstanding contracts in the market, showing where traders have built positions.
- High call open interest can act as resistance, especially at slightly out-of-the-money strikes among shorter-dated options.
- Option sellers will begin to unwind their hedges as the stock approaches the strike level, adding pressure to the underlying shares.
- Heavy put open interest can act as support, as traders sell puts to minimize risk and remain market-neutral.
- Put writers might sell the underlying stock short to balance their sold positions.
- When the options expire or the put buyers unwind their positions, short interest on the equity will be repurchased, adding to buying pressure as the underlying shares approach noteworthy strikes.
Calculating Key Levels of Support and Resistance Using Open Interest
As said earlier, To use Open Interest to identify potential support and resistance levels, start by looking for areas of significant Open Interest.
So,
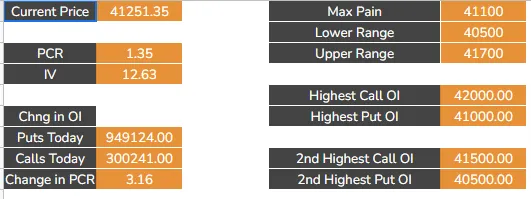
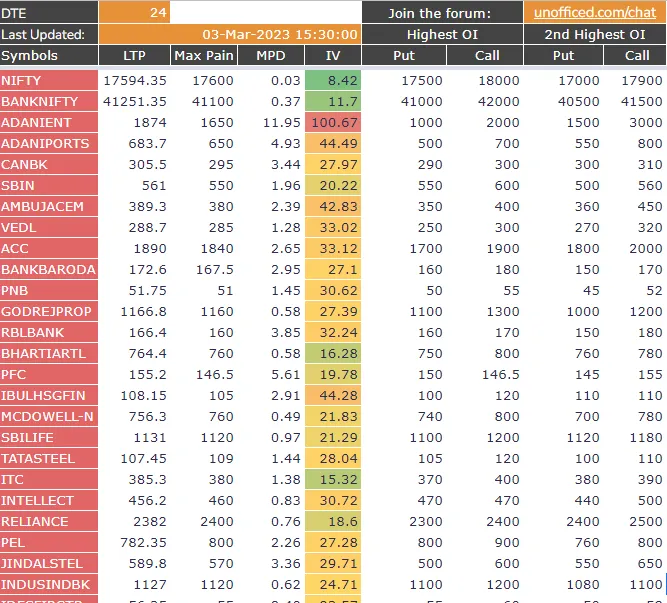
- The strike price where we have the highest open interest in the call options indicates the strongest resistance. Let’s call it R1.
- The strike price where we have the highest open interest in the put options indicates the strongest support. Let’s call it S1.
Similarly,
- The strike price where we have the second highest open interest in the call options indicates the second strongest resistance. Let’s call it R2.
- The strike price where we have the second highest open interest in the put options indicates the second strongest support. Let’s call it S2.