Flag Patterns: Part I – The Basics of Flag Pattern

Flag Patterns: Part I
- The Basics of Flag Patterns
- Psychology in the Flag Chart Patterns
- Types of Flag Pattern
- Bullish Flag Pattern
- Bearish Flag Pattern
The Basics of Flag Pattern
While discussing Bounce Theory, We have divided The Market into broadly three trends – Uptrend, Downtrend, Sideways Trend.
The Flag Pattern is formed when the market consolidates ( read, Sideways Trend ) in a narrow range after a sharp move ( read, Uptrend or Downtrend ).
It gives us the opportunity to enter the market in the middle of a trend.
Example:
In this chart, ICICI Bank is rising upside. We can label it as an Uptrend with respect to the “D” Timeframe.

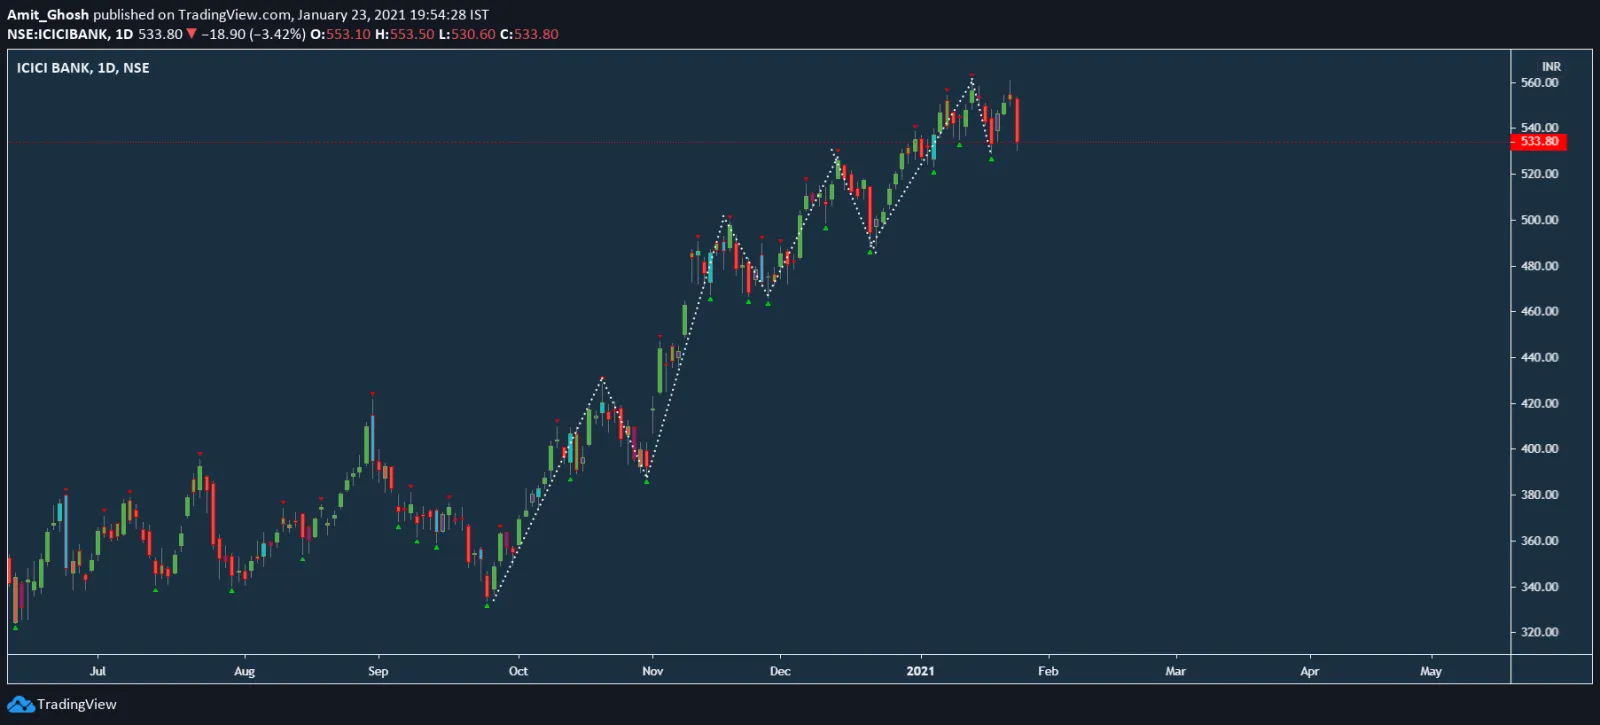
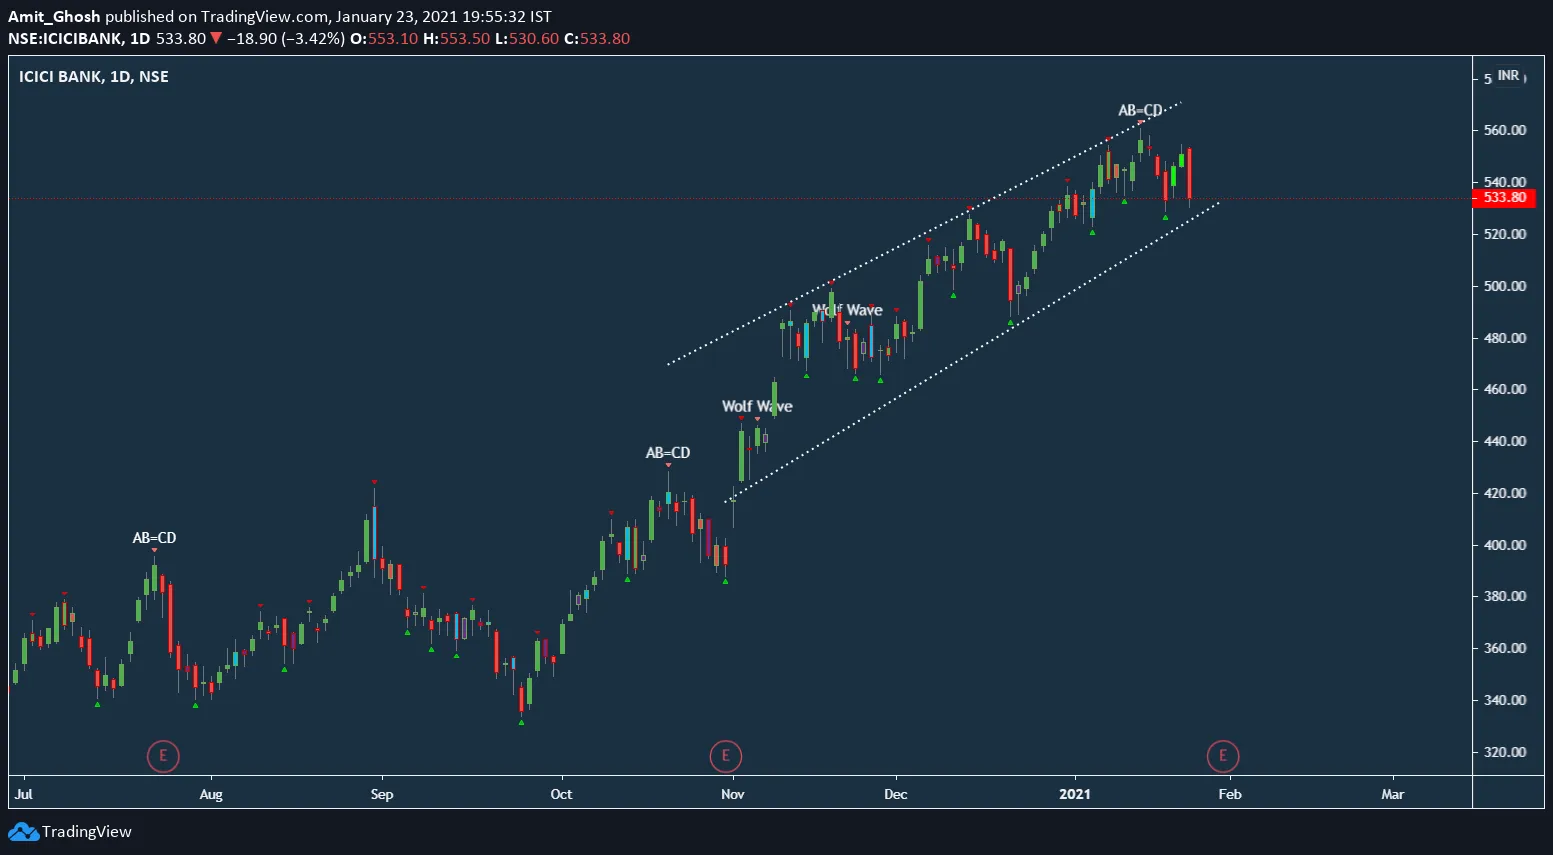
If We shift the timeframe to higher, it will be more clear –
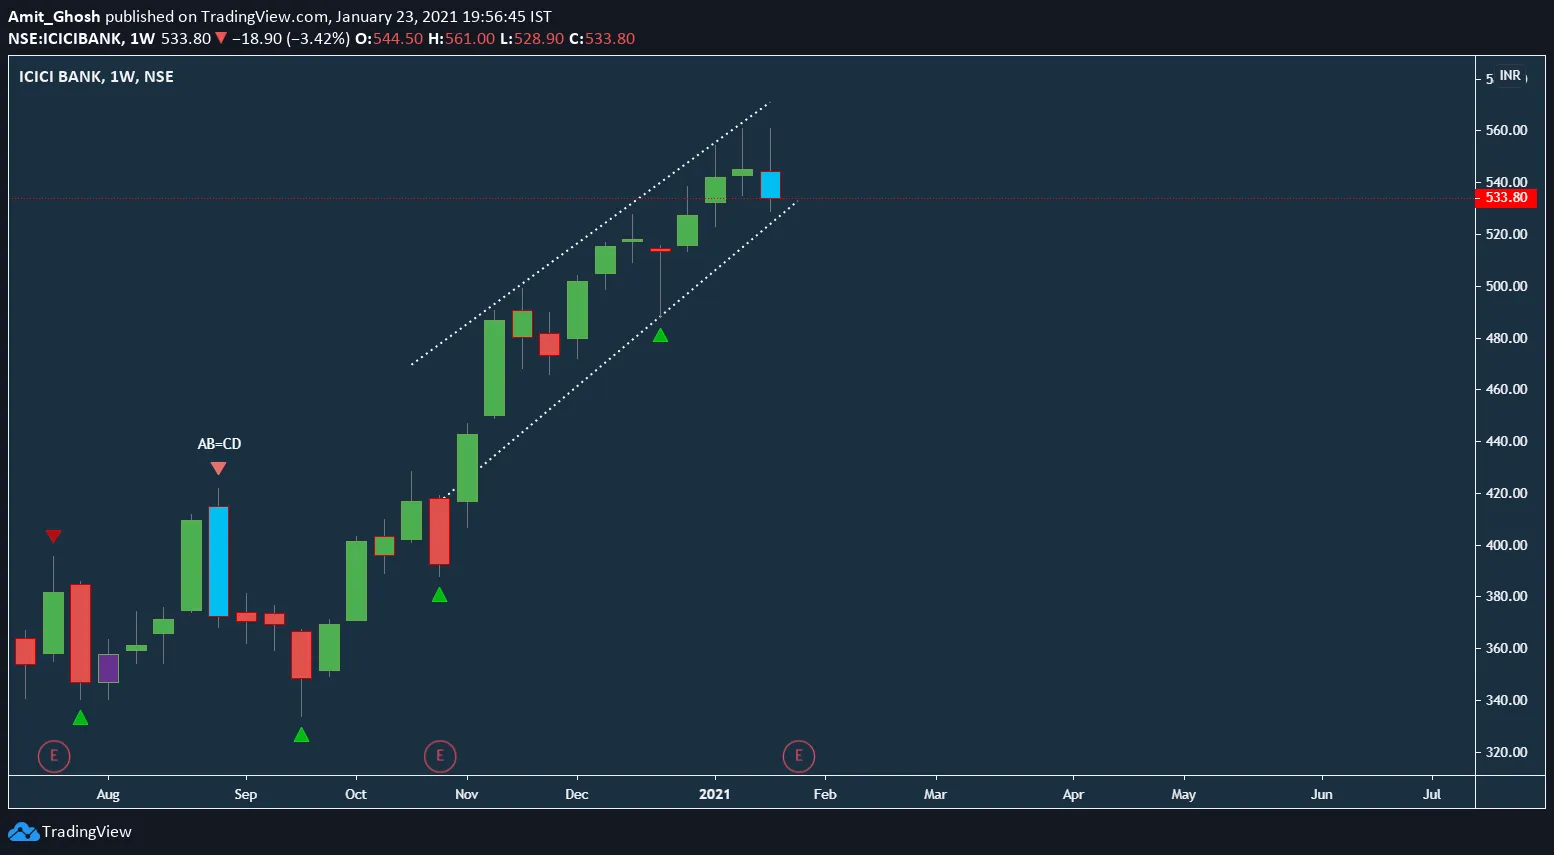
Right now, What You’re seeing is a pure uptrend with no serious consolidation. Now, The Flag Pattern will occur when the price pauses and starts moving in a range.
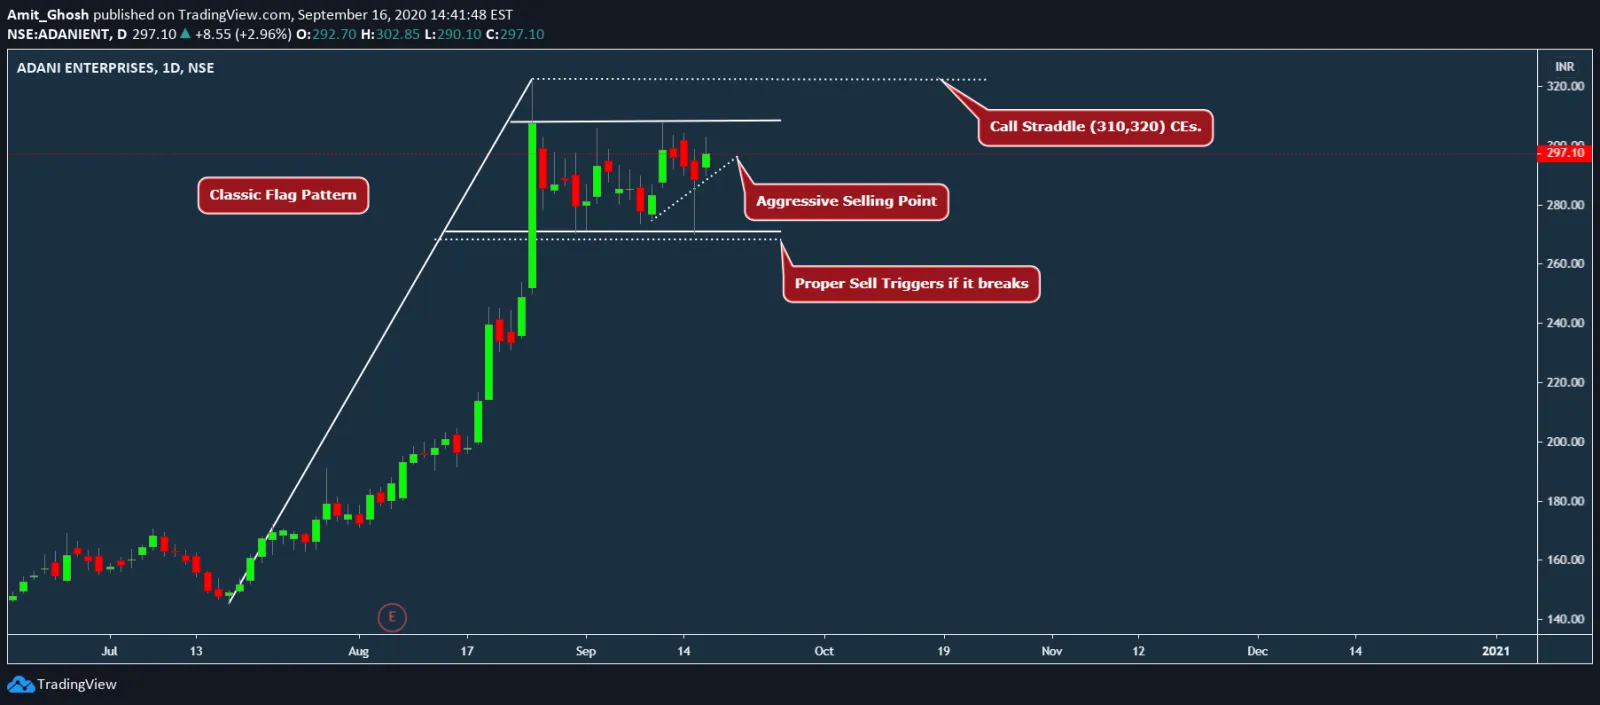
Here is an example of the Classic Flag Pattern that occurred in Adani Ent a few days back.
Psychology in the Flag Chart Patterns
If a flag is formed after an uptrend; it will have a tendency to move downside. So, the Flag will (read, should often) move opposite direction to the original trend.

In this chart of AuroPharma, You can see it has retraced almost 61.8% in this Flag Setup.
Now, Our core assumption is – It will eventually give a breakout (or, breakdown) and will continue the trend. So, in short, a Flag Pattern is a trend continuation pattern that allows you to catch a trend in the middle!
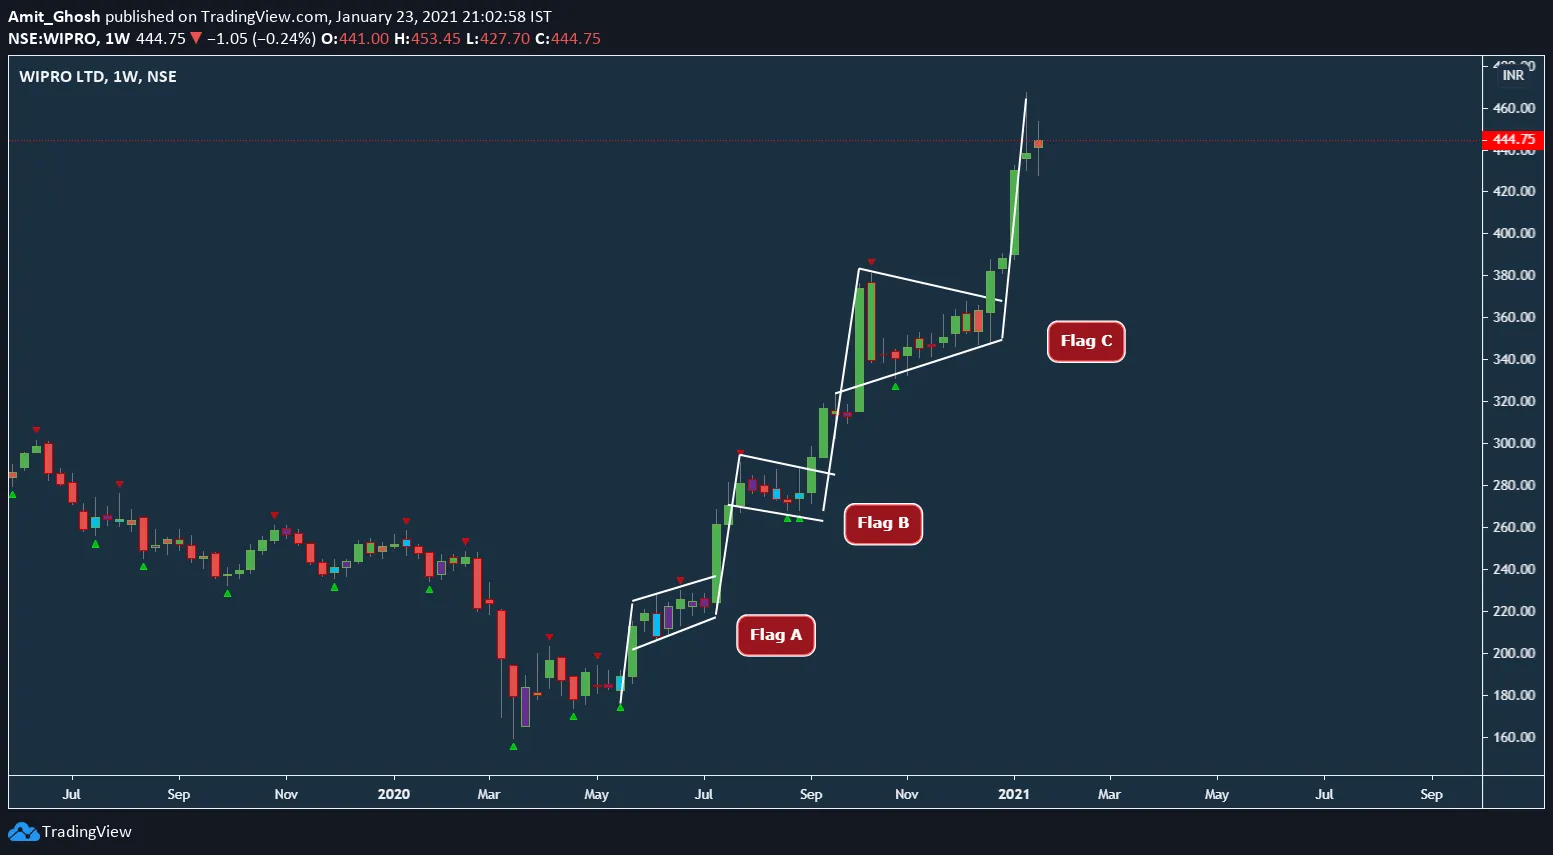
If We revisit the recent amazing Uptrend of Wipro, You can see there are three clear Flag Formations in the W timeframe.
What we should note here is – The first flag kept going upside. The second flag retraced. The third flag made a converging pattern.
In the end, it kept continuing the trend! If we summarize using Bounce theory, the flag is basically giving more structural formations of Higher Highs and Higher Lows.
Types of Flag Pattern
Now, As we have three types of trends. We have two types of Flag Patterns.
- Bullish Flag Pattern
- Bearish Flag Pattern
Anyways, Traders combine this pattern with various other forms of technical and fundamental analysis! We will plunge into case studies more later on.
Bullish Flag Pattern

Update:
Auropharma broke out just after the next trading day after our discussion showing a perfect “desired” outcome of a Bullish Flag Pattern.

But –
How I chose Auropharma all of sudden?
And, Was it pure luck? This breakout was quite a momentum.
It is a Classic Example of Bull Flag Pattern.
Remember this line – Now, Our core assumption is – It will eventually give a breakout (or, breakdown) and will continue the trend.
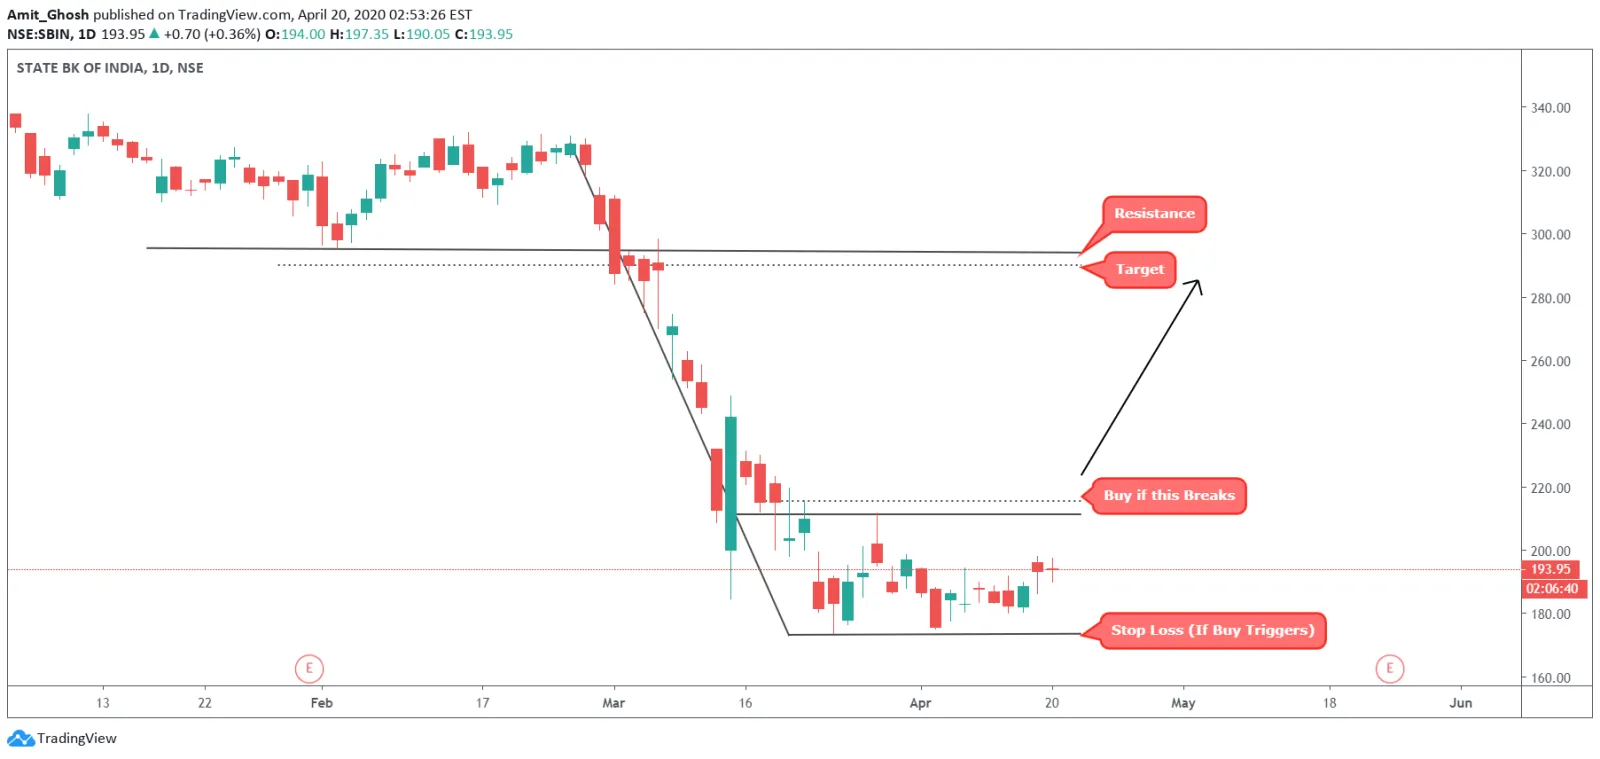
Bearish Flag Pattern

Here is another example but this time it is classic bear flag in BankNIFTY and in smaller timeframe –
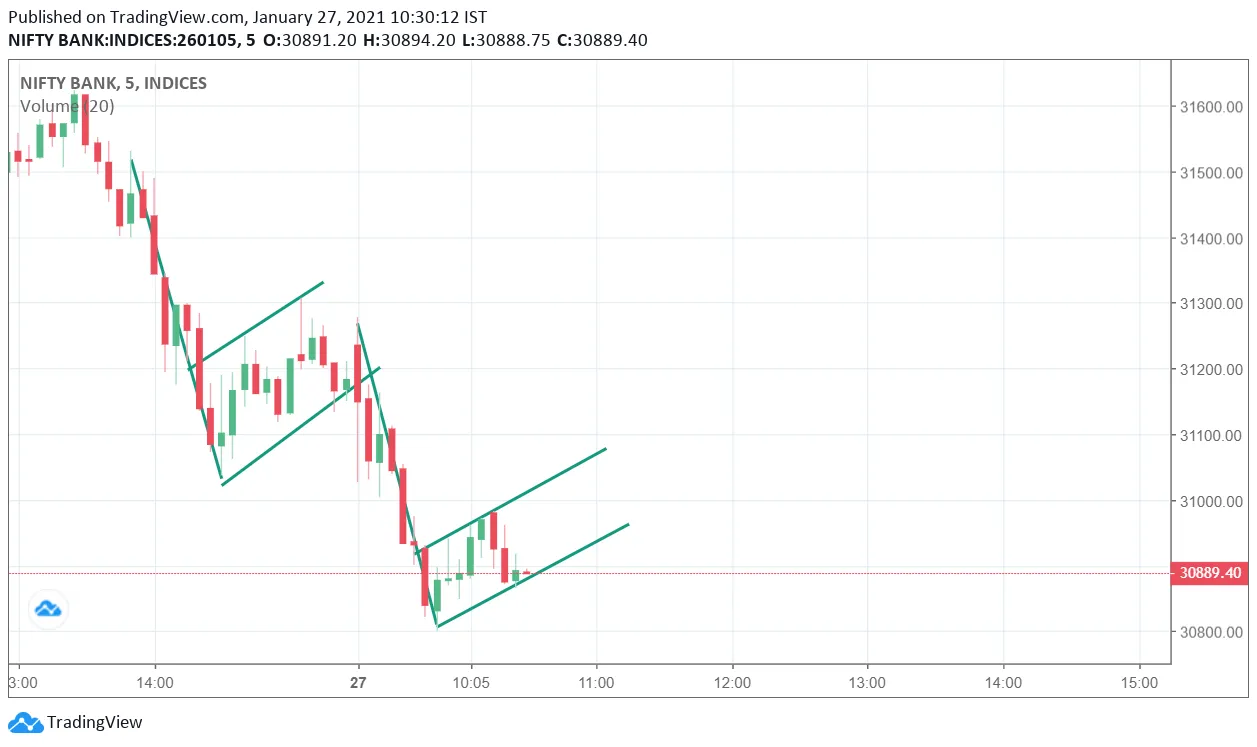
BankNIFTY fell more than 500 points after this above chart is shared in the forum.