Week 5 - Compression Chart Patterns - II
Rising Wedge Pattern
1 Topic | 1 Quiz
Week 5 - Flag Chart Patterns
Week 5 - Final Assignments
Flag Patterns: Part VII – Proper Trigger Points

Let’s revisit the trade setup of Infosys –
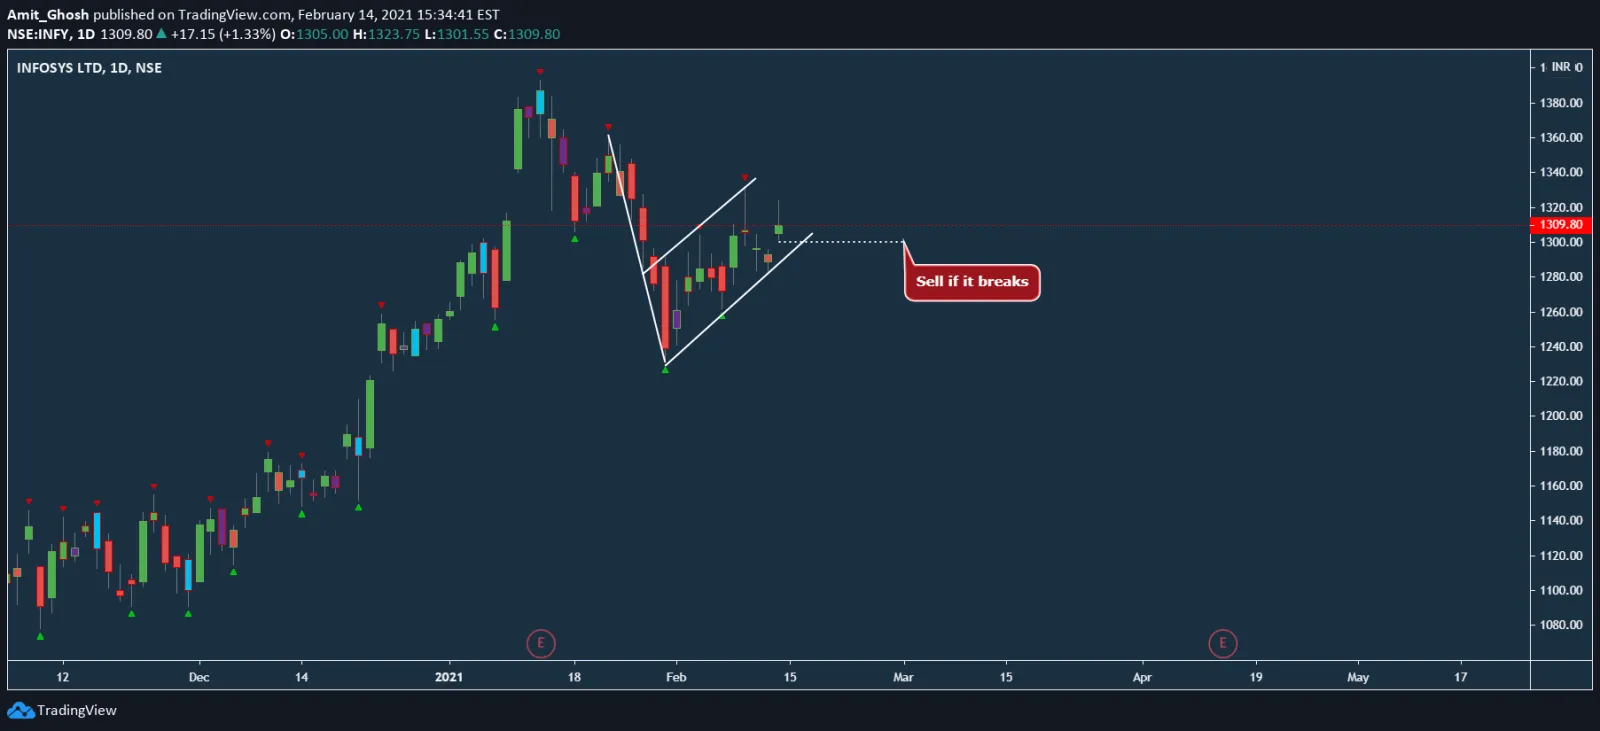
The upper trendline and lower trendline of Flag also are considered as support and resistance. So, We can use our theories of Support and Resistance to increase our probability of profit.
Let’s discuss improvision and practicality!
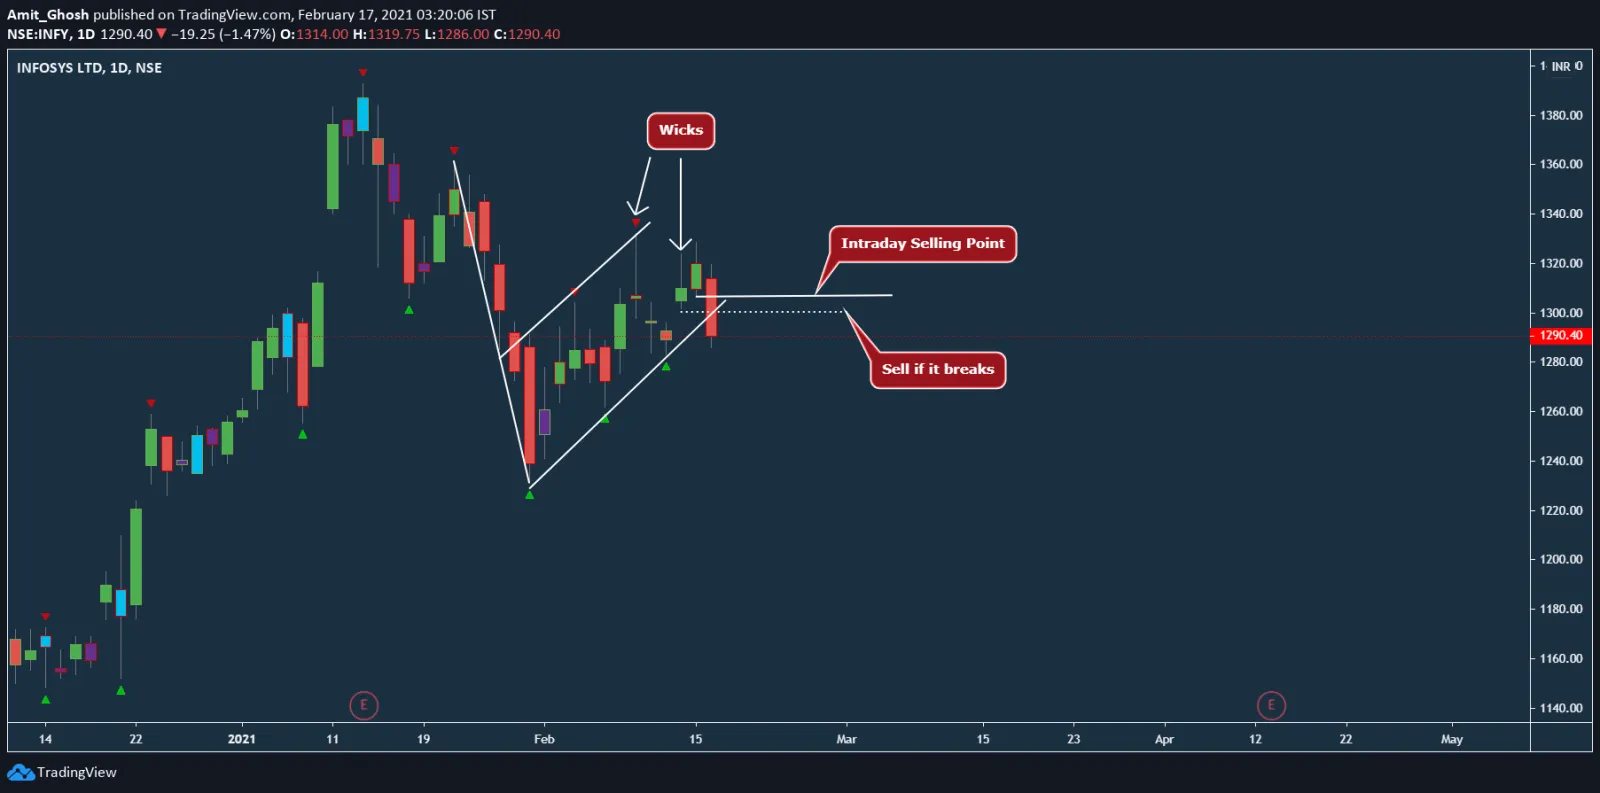
In the Infosys trade,
- You can see bearishness from the wicks as mentioned above.
- You can shift the selling point to Previous Day’s Low as per Price Action Theory. The SL also gets reduced in this way.
- Now, Note that it did not trigger sell at all as per our theory, It should trigger sell if this current candle’s low is broken tomorrow. Right?
- But, Our current bet is on the “price action” (read, high movement) that is created by the flag’s lower trendline break. As the trade is not confirmed and it is a chart of D frame, It is preferred to exit in Intraday itself!
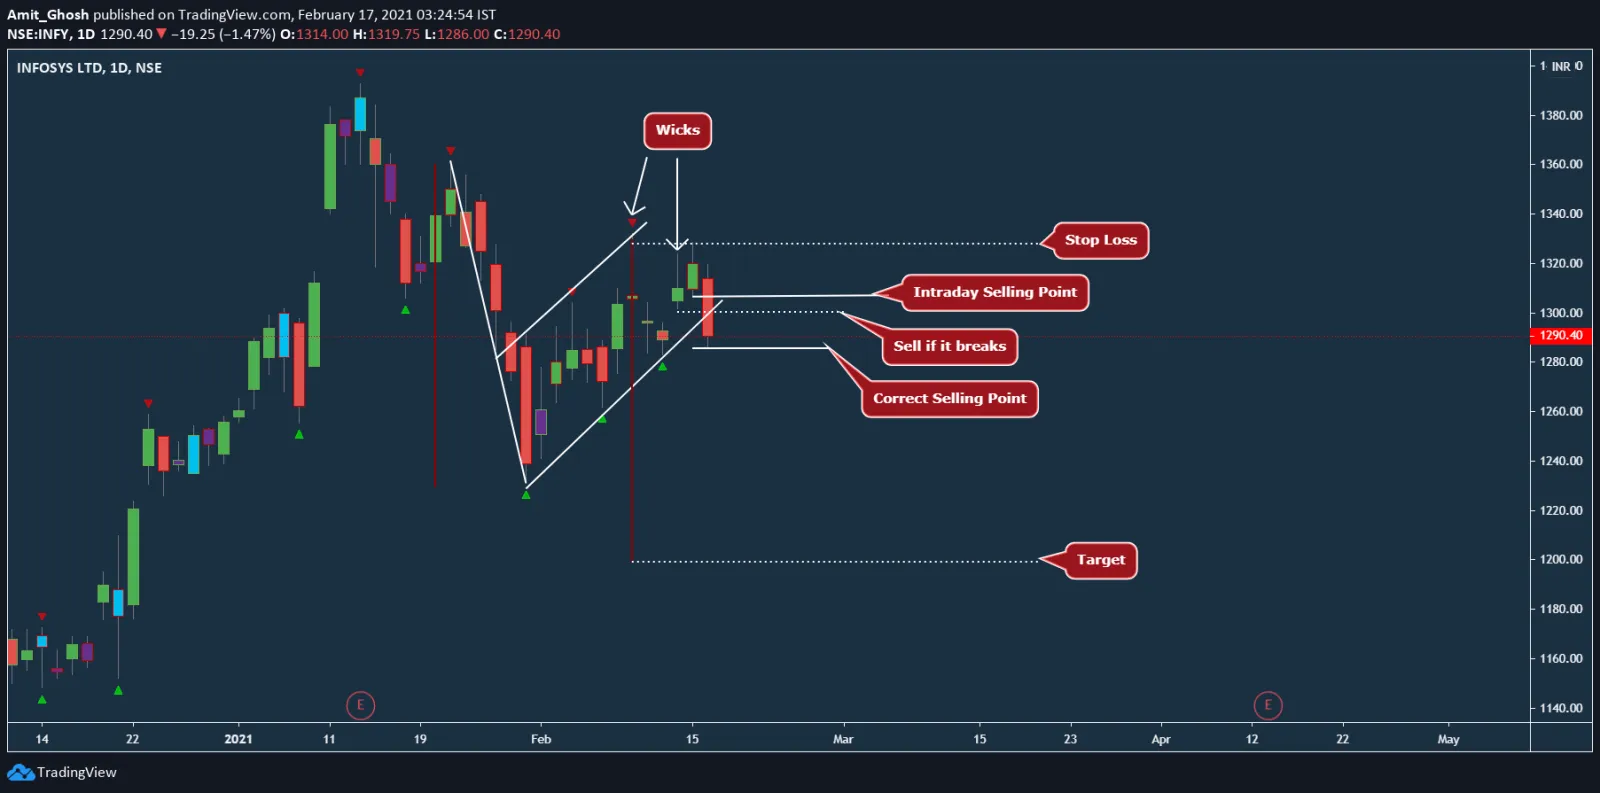
- There are many cases where it rebounds back sharply to the channel.
Note – As we know, Two trendlines create Channel. The upper trendline and lower trendline of Flag is creating a channel hence.
In this chart, I took liberty to draw the proper target and stop-loss as per plain theory.
Post a comment