What is an Inside Bar?
Inside bar trading strategy allows you to catch momentum in the market with a small stop loss.
What is an Inside Bar?

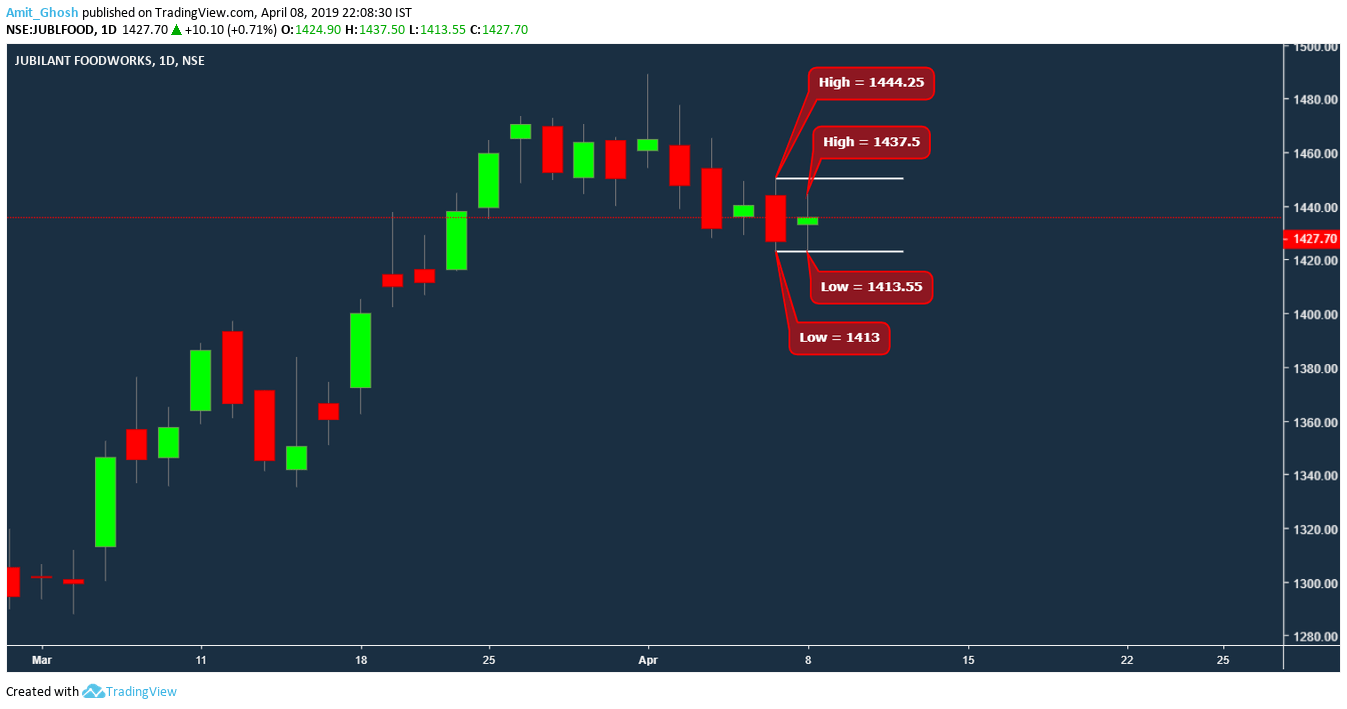
In the above chart, We are seeing Jubilant Foodworks in Daily time frame, (Note – The use of time frame is very important as candlesticks changes in different time frame) We can see today the candle (or bar) is “inside” the candle of the previous day.
Today’s bar is “inside” the previous bar’s range. This is called the Inside Bar which is used for inside bar trading strategy.
The colour of the candle doesn’t matter! The high and low of today’s candle has to be lower and higher respectively than the previous day’s candle.
Nested Inside Bar
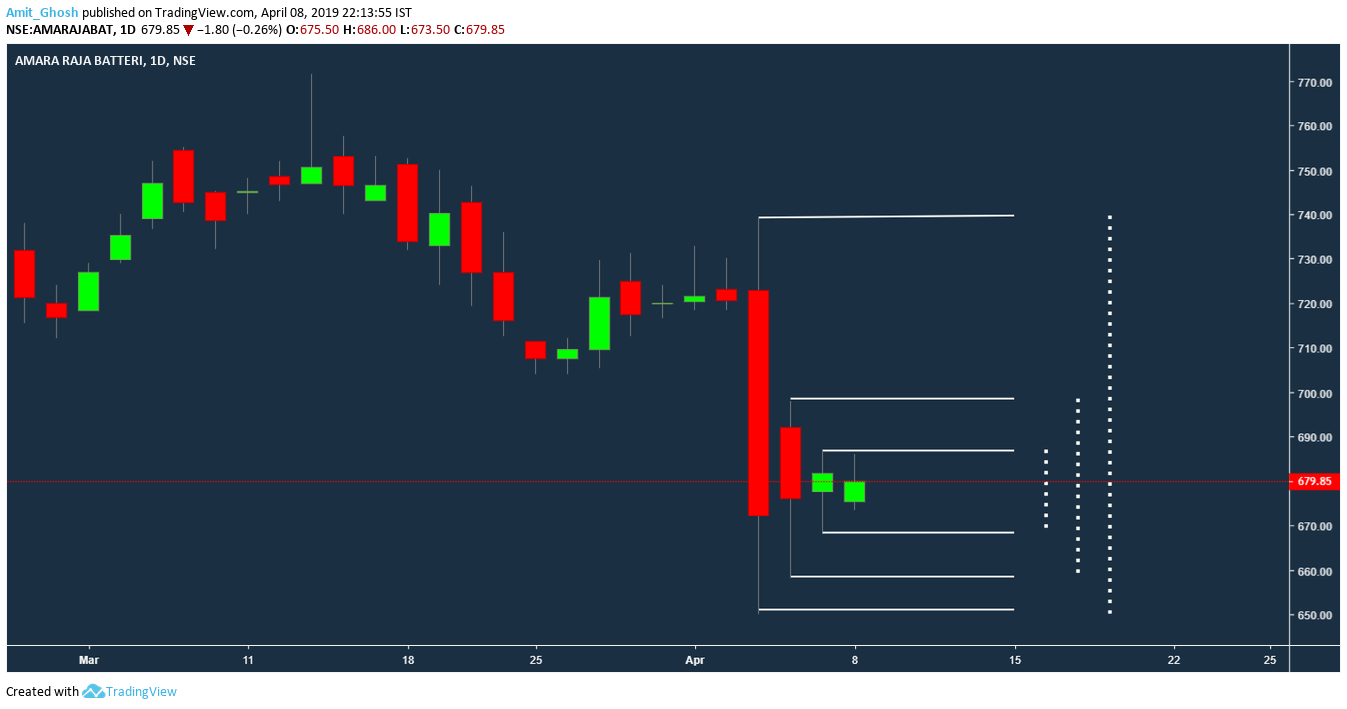
If you see Amara Raja Batteries in the daily chart, you will find something amusing. It is sort of “inside inside inside” bar. We call it nested inside bar.
Today, 14 stocks out of 200 made an inside bar pattern. The pattern is quite common. Then, even before the question on how to trade it, the question that comes is – Which one to trade?
Before we discuss that, let’s look into some more specifics.
Inside Bar trading in Tight Consolidation
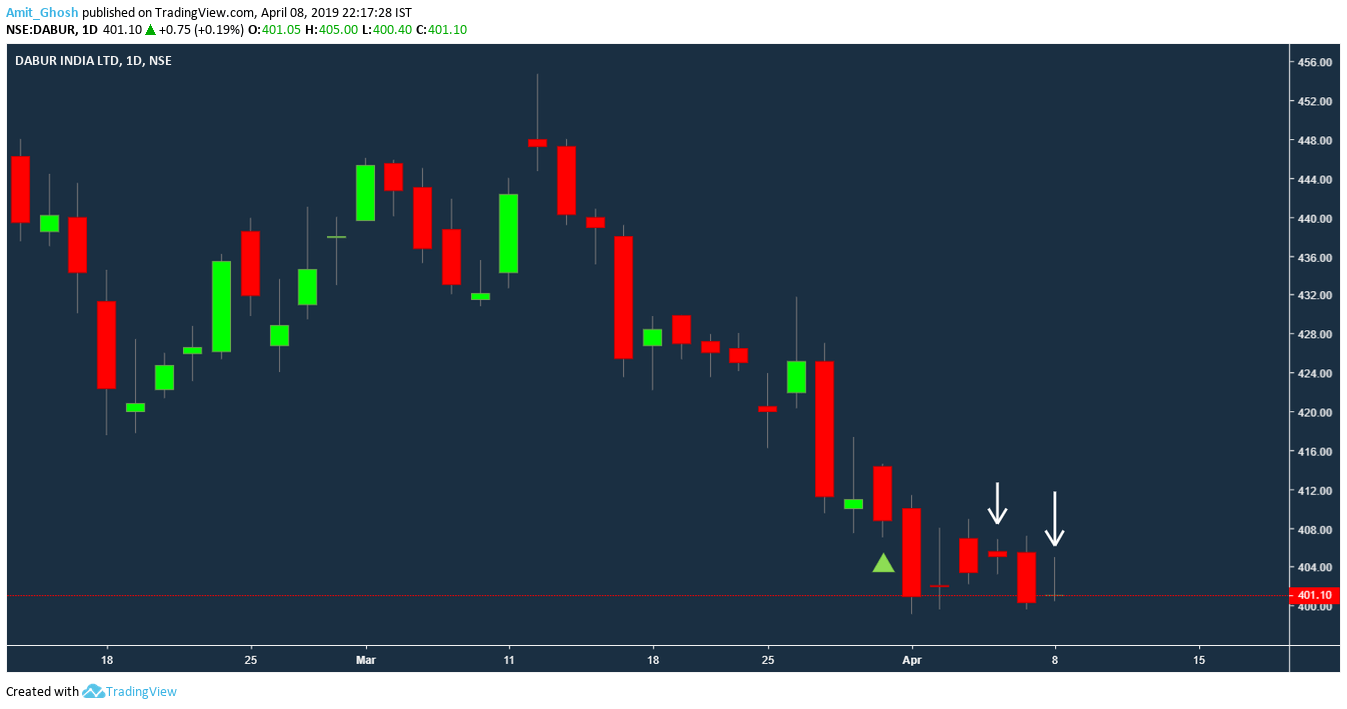
Here goes another chart of Dabur in Daily timeframe. It has also formed an inside bar.
But the day before yesterday it was also an inside bar whose low got breached in the subsequent day but the consolidation is still intact. There is no big movement in either direction.
What is the difference between Jubilant, Dabur and Amara Raja Battery? Who is the better candidate for our watchlist?
Inside Bar on Support
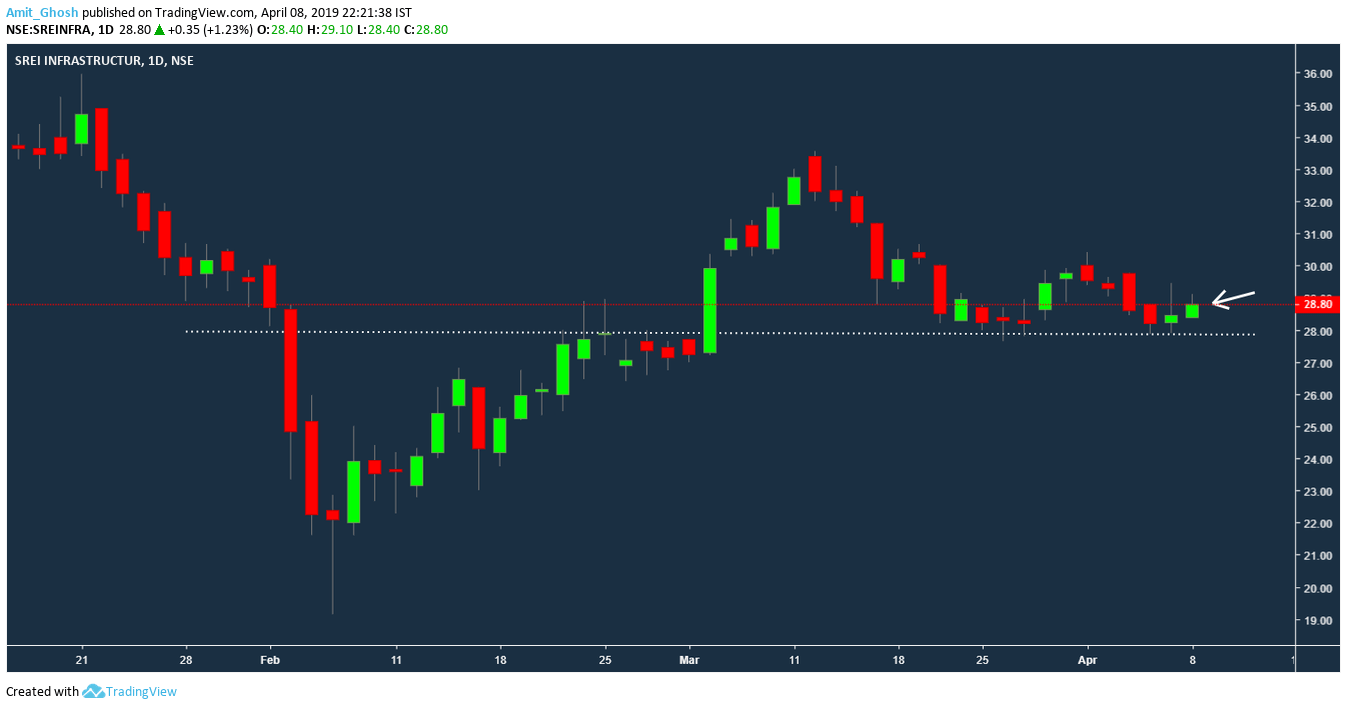
In this case of SREI Infrastructure, the case is also different. It is sitting on support. (We call it neckline as the line was resistance before and turned into support.)
Each case of Inside Bar is coming with own set of patterns governed by price action.
Before we dip into further analysis, let’s have a look at the part on how to trade it so that we can judge which one fits better as a candidate for trading.


[…] case we are spotting the Inside Bar in Daily time frame, the inside bar will only form after the candle is finished which is at the end […]