The Diamond Bar Pattern

What is the Diamond Bar Pattern?
The Diamond Bar Pattern is a unique formation observed in the candlestick charts of various assets.
- Predominantly appearing in futures trading, this pattern comprises five distinct candlesticks.
- At its core, it signals a potential reversal in the market trend, making it invaluable for traders anticipating a shift in market dynamics.
Formation of the Diamond Bar Pattern
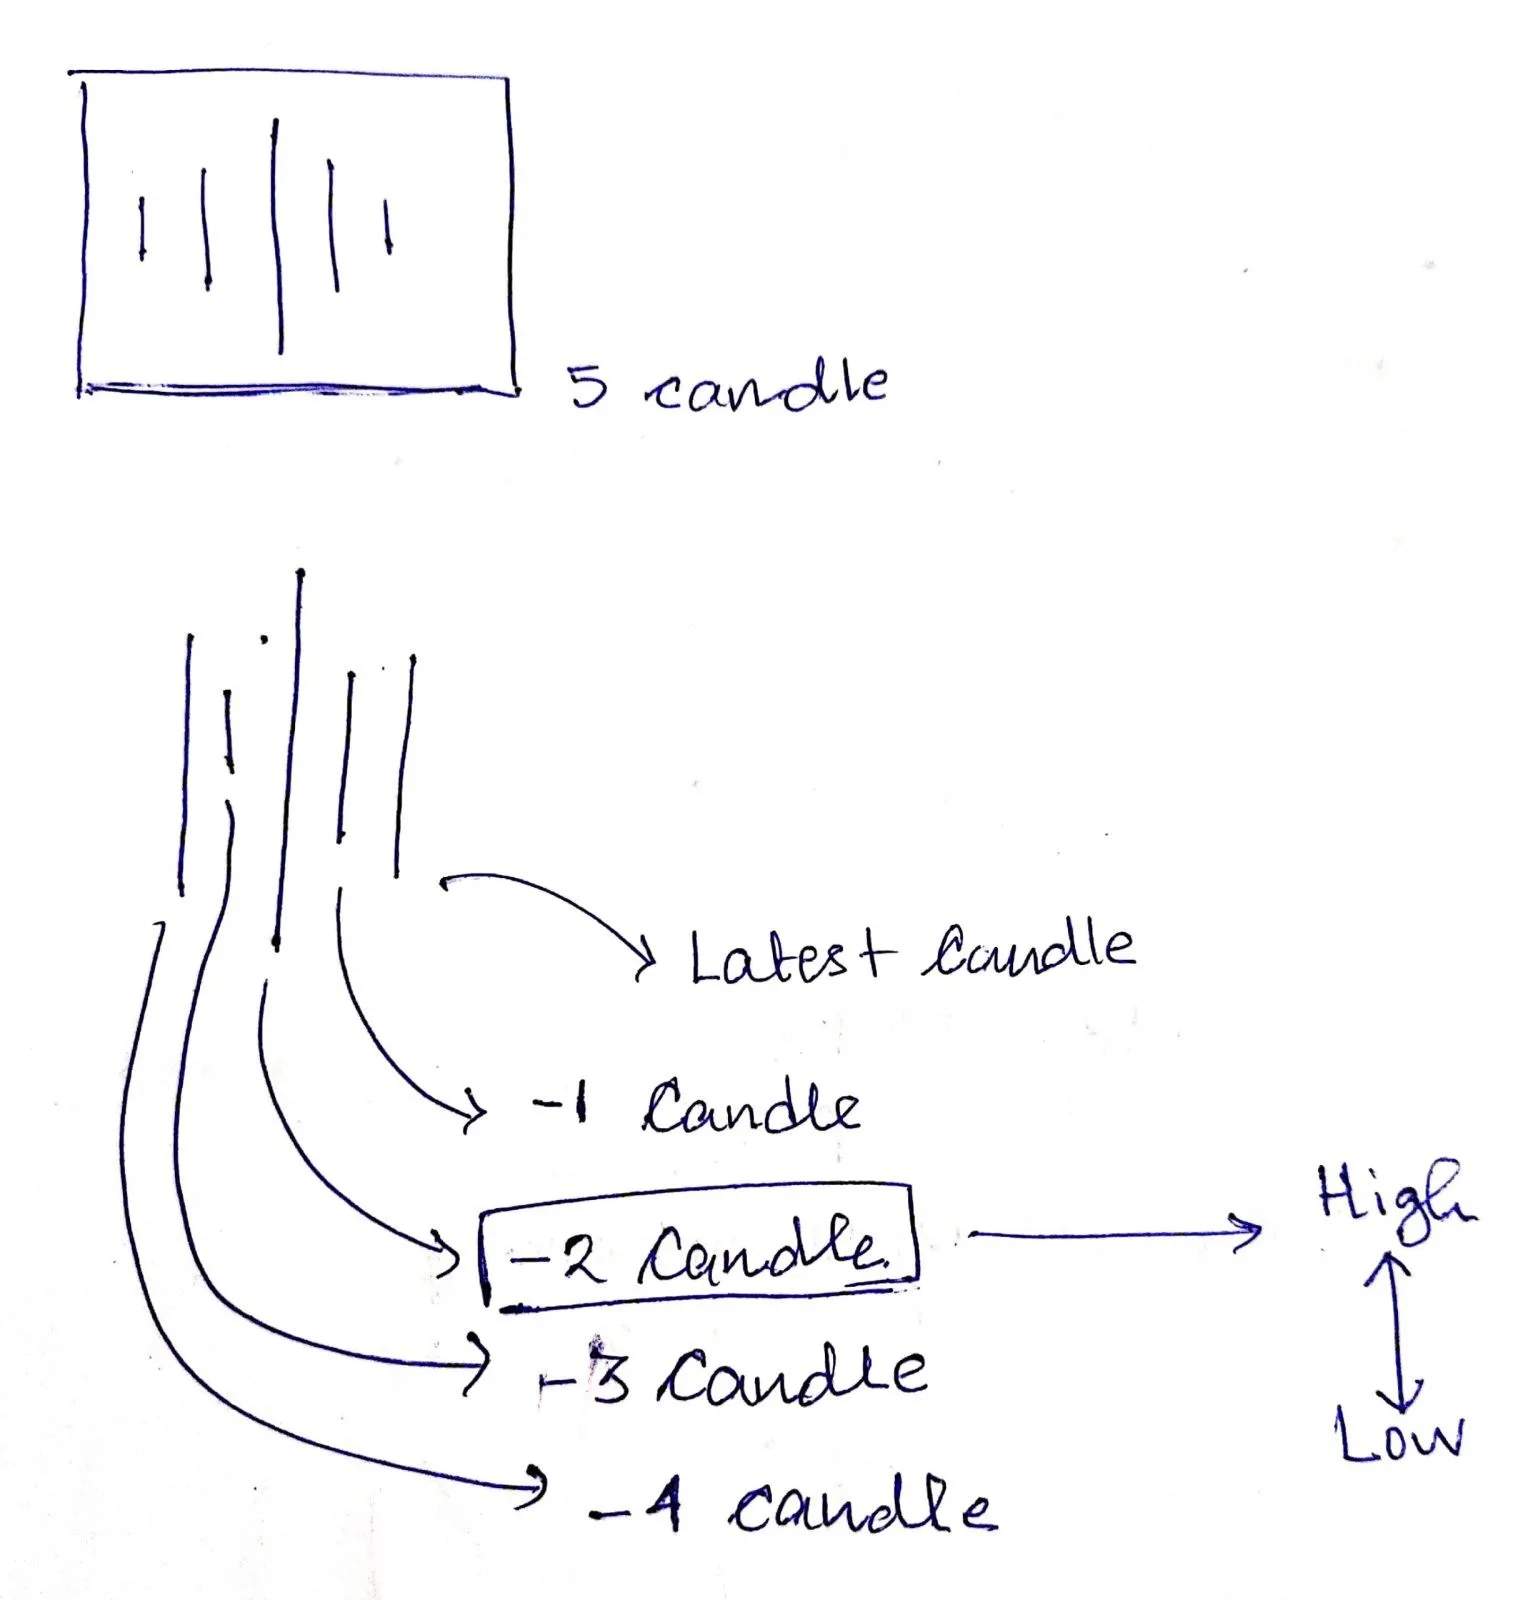
The formation of this pattern is based on a series of highs and lows over a span of five days. To better understand, consider the following criteria that the Diamond Bar Pattern adheres to:
Latest Candlestick:
- High is lesser than the high of the candlestick from two days ago.
- Low is greater than the low of the candlestick from two days ago.
1 Day Ago Candlestick:
- High is lesser than the high of the candlestick from two days ago.
- Low is greater than the low of the candlestick from two days ago.
3 Days Ago Candlestick:
- High is lesser than the high of the candlestick from two days ago.
- Low is greater than the low of the candlestick from two days ago.
4 Days Ago Candlestick:
- High is lesser than the high of the candlestick from two days ago.
- Low is greater than the low of the candlestick from two days ago.
When these criteria converge, the Diamond Bar Pattern is realized.
Significance of the Diamond Bar Pattern
-
Reversal Indicator: At its essence, this pattern hints at a potential market reversal. Traders often look for such patterns to adjust their strategies, ensuring they’re in line with the anticipated market direction.
-
Reliability: Due to its meticulous criteria, the Diamond Bar Pattern isn’t frequently observed. However, its rarity is what adds to its reliability. When it does appear, traders take heed.
Application in the Buddha System
The Diamond Bar Pattern finds a special mention in the Buddha System – a trading approach based on the Inside Bar strategy.
This system, dedicated to the F&O market, has cemented its reputation by focusing on patterns that offer high potential rewards. The Diamond Bar Pattern is one such formation, standing tall among others like Double Inside Bar, NR7 + Inside Bar, and Triple Inside Bar.
What sets the Buddha System apart is its emphasis on transparency. The system shares live trade entries and exits, allowing traders to gain insights into real-time trading decisions. The Diamond Bar Pattern, with its distinctive formation and implications, becomes a pivotal part of this strategy.
You can see the Diamond Bar Scanner showing which stocks are currently showing this pattern, saving them a lot of time and effort.
It’s like having a special tool that highlights opportunities, making it easier for traders, even beginners, to potentially benefit.
The watchlist generated by Buddha focuses on stocks that exhibit specific patterns, including:
- Double Inside Bar
- NR7 + Inside Bar
- Triple Inside Bar
- 3% Gap Down or 3% Gap Up
- Index Inside Bars
- Diamond Pattern
Here is an exmaple of Diamond Bar Pattern on AdaniPorts spotted at 06th Oct 2023 in Daily Timeframe –
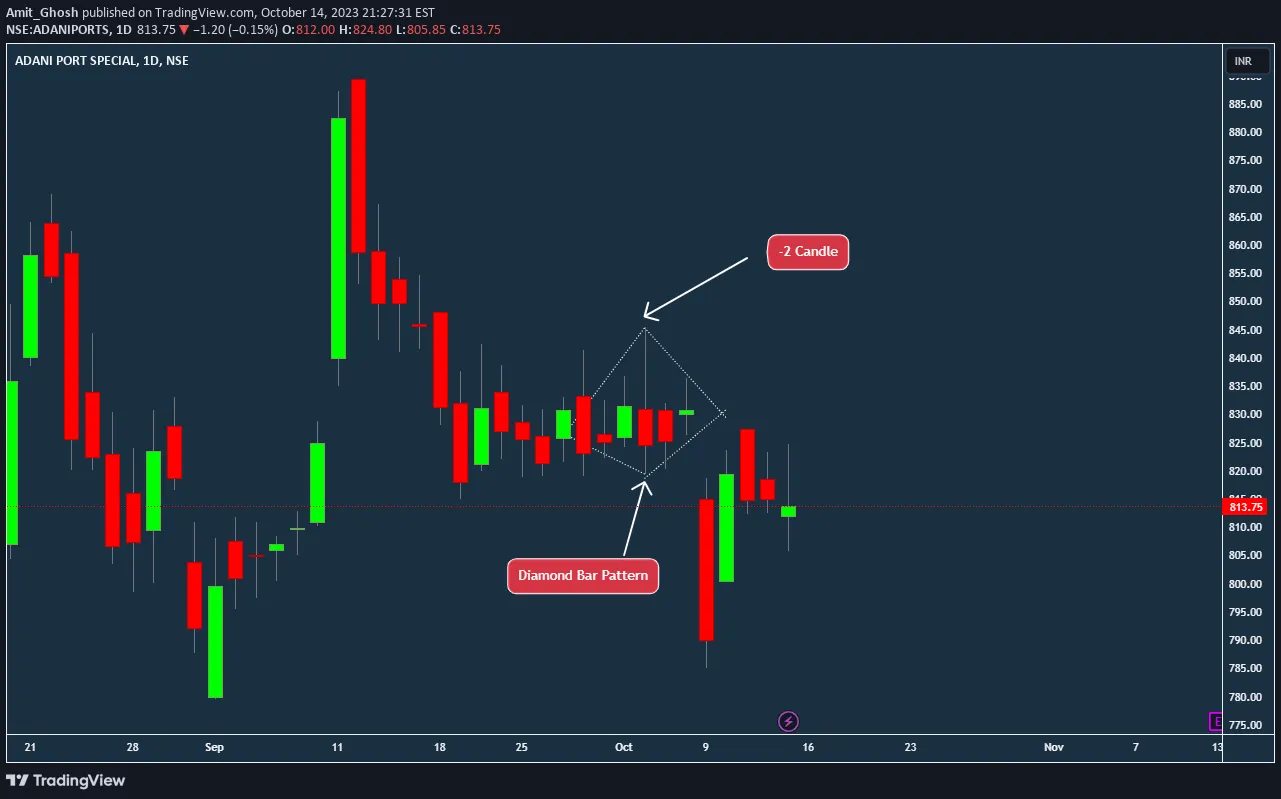
The chart provided showcases the stock performance of Adani Ports, and if you observe closely around the date of October 6th, 2023, You can see the “Diamond Bar Pattern” as discussed here.
Now, focusing on the Diamond Bar Pattern: It’s formed over a series of five candles. If you look at the section highlighted in the chart, you’ll notice a kind of squeeze or narrowing down where the price range becomes smaller each day until it forms the central point of the diamond. After this, the range starts to expand, completing the diamond shape.
The significance? This particular pattern can act as a hint or a heads-up for traders. It suggests that the stock’s current trend might be about to change direction. Or, Specially it is a sign of decompression! That’s why it falls under Time Compression Theory.
The next day, it not only just broke down but also gapped down violently proving its effectiveness to spot instruments that are about to breakout or breakdown!
Diamond Bar vs Diamond Top
The Diamond Bar Pattern, despite its name, stands distinct from the more commonly known Diamond Pattern Trading strategies prevalent in the market. While they both bear the moniker “diamond,” their formations and implications diverge considerably.
The latter is specifically anchored in what’s termed a diamond top formation.
This particular configuration earns its nomenclature from the trendlines that connect the various peaks and troughs defined by the security’s price action, which, when visualized, resemble the multifaceted shape of a diamond. It’s crucial for traders and analysts to recognize this differentiation, ensuring they apply the appropriate strategy and understanding to each pattern.