Comparing Equity Curves of Reliance and Vedanta with Gann Square of 9 Strategy

In the following section, we present two Equity Curves, which are a graphical representation of the cumulative Profit and Loss (P&L) over time.

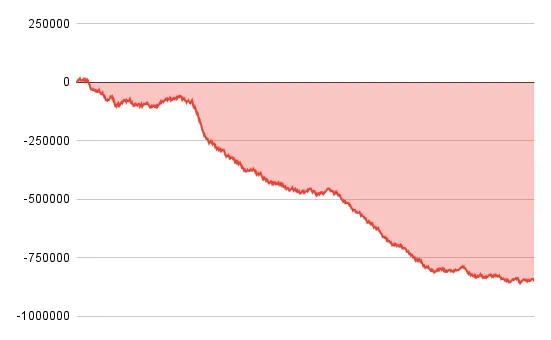
This curve is a result of deploying the strategy on Reliance, a prominent company within the Indian Stock Market.

It’s worth noting that Reliance holds a unique position as one of the most liquid stocks in India, and its diversified nature allows us to liken it to an index due to its widespread influence in the market.

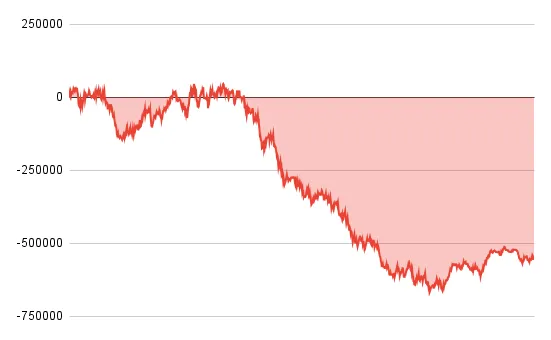
The presented Equity Curve has been generated through the deployment of the strategy on Vedanta, a distinct company within the market. Vedanta, characterized as a mining company, exhibits a notable correlation with commodity prices. Moreover, a significant portion of Vedanta’s valuation derives from its holdings in various commodities.

It’s particularly interesting to note that W.D. Gann was primarily renowned for his expertise in trading commodities. Commodities, as distinct from stocks, possess unique attributes that make them a distinct asset class within the financial landscape.

They tend to be less susceptible to manipulation, owing to their inherent market dynamics. Unlike stocks, where a multitude of events can influence performance and where the lifespan of companies is often limited, commodities remain enduring assets, with none facing the risk of extinction. This enduring quality of commodities adds an intriguing dimension to their appeal in the world of trading and investment.

Comparing other trading metrics

Here are some key metrics of this strategy’s deployment over Reliance –

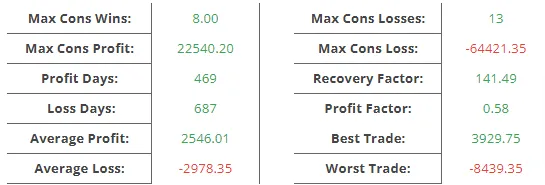
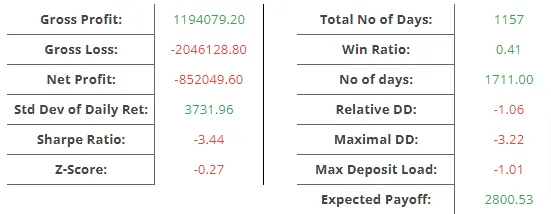
The data, coupled with the displayed Equity Curves, unmistakably illustrates a noteworthy pattern of substantial and persistent losses associated with the strategy. This consistency in losses is a critical observation and demands a thorough analysis and reassessment of the strategy’s parameters, risk management, and overall suitability for the current market conditions.

Here are the same metrics of the strategy deployment over Vedanta –

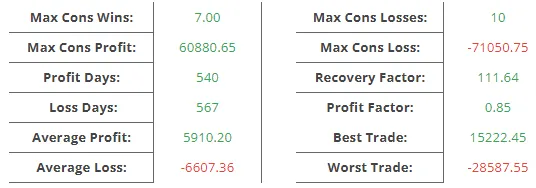
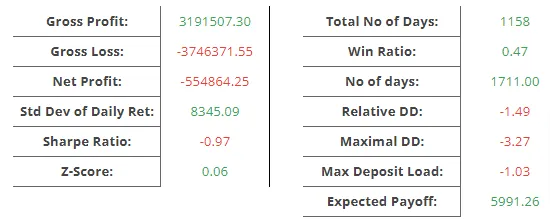
he strategy in this backtest analysis has been deployed over a capital of 5,00,000. In the both cases of Vedanta and Reliance it has gone beyond 100% drawdown.

Gann Square of 9 is a loss making strategy!

The backtesting results unequivocally demonstrate that the Gann Square of 9 strategy not only fails to perform as expected but actually yields favorable results when taking the opposite trade approach. In other words, selling when there is a buy entry appears to be more profitable, with the buy target serving as our stop loss for the sell trade, and so on.

Or, is it Misinterpreted?

It is also making the loss flawlessly!

Indeed, when a strategy does not perform with flawless precision, it warrants careful consideration and scrutiny. While this particular strategy has garnered considerable attention and adoption, it is apparent that there may have been misinterpretations and blind replication, potentially leading to unfavorable outcomes.

Deploy The Reverse Trading Strategy

The strategy employed here takes a contrarian approach to the widely accepted interpretation of the Gann Square of 9. In this context, the strategy entails a reversal of the typical directives. Specifically:

  • “Sell if the price goes below x” is transformed into “Buy if the price goes below x.”
  • “Buy if the price goes above x” is converted into “Sell if the price goes above x.”

This strategic shift uses Gann Square of 9 as a calculator for the levels but just changing the way the levels are used. And, it will grow the capital beyond double if it gives similar return like before.

The current Profit and Loss screen at the day of 15th September, 23 shows the output of the strategy if done correctly.

Now here is the outcome of reversed trades –

Daywise Analytics on Gann Square of 9 Strategy

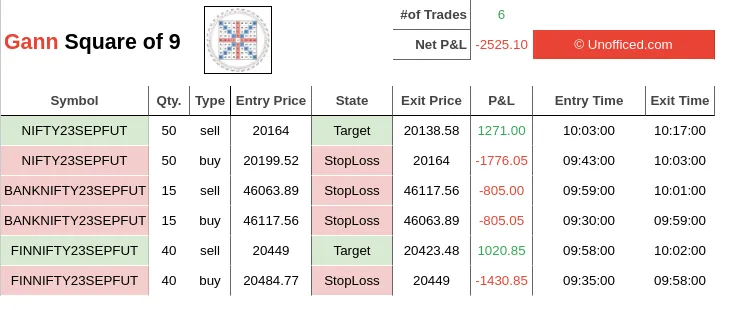
We are essentially wagering against the efficacy of the initial interpretation of the strategy, expecting it to perform suboptimally.

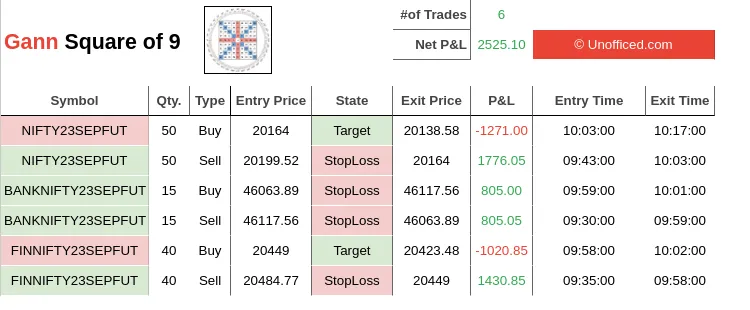
It’s particularly intriguing to note that our journey of exploring the traditional and widely adopted strategy has led us to the discovery of a profitable alternative.

This process has involved challenging the effectiveness of the original strategy and, in doing so, has illuminated a more successful path forward.

However on a different note, here is another observation –

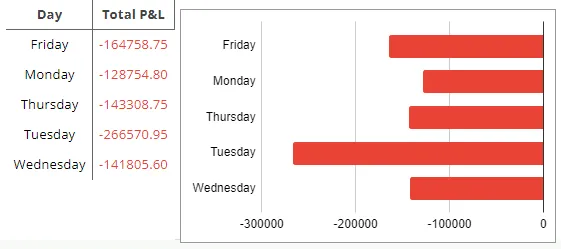
The above data is from Reliance’s and the below data is from Vedanta’s.

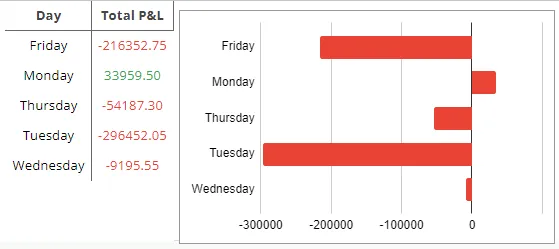
In both cases, it’s worth highlighting that Tuesday consistently stands out as the day when the strategy incurs the highest losses, closely followed by Friday. This observation implies that our contrarian strategy should ideally yield the most significant profits on these particular days.

However, it’s essential to exercise caution when interpreting these results, as achieving such precise historical patterns may have limited probability.

The fact that our backtesting only covers a four-year period means that the sample size is relatively small, but nonetheless, this observation remains intriguing and merits further investigation.

Some practical rules of W.D. Gann that can be applied

Here are some practical rules derived from the teachings of W.D. Gann that can be applied in trading:

  1. Resonance of Numbers: While Gann’s trading methods have not been scientifically proven, the principles of patterns and numerical harmony he discussed resonate not only in mathematics but also in various sciences, including trading, architecture, and design.
  2. Friday’s Impact: If the high price occurs on a Friday (the last trading day of the week), it suggests that the following week is likely to see higher highs. Conversely, if the low price occurs on a Friday, it indicates the potential for lower lows in the next week.
  3. Day of the Week Trends: In a robust uptrend, weekly lows tend to be established on Tuesday. Conversely, in a strong downtrend, the weekly highs are often reached on Wednesday.
  4. Four-Week Indicator: A breach of a four-week high or low can serve as a reliable indicator of further highs or lows, respectively. This roughly corresponds to a one-month timeframe.
  5. Ratio Patterns: The 9:5 ratio suggests that if a price trend persists for 9 consecutive days, it may correct for 5 consecutive days. Additionally, double bottoms and triple bottoms on a monthly chart, with a minimum gap of 6 months, can signal the beginning of a fresh uptrend, while double tops and triple tops in monthly charts after a similar gap can indicate a fresh downtrend.
  6. Support Levels: Generally, the 50% mark of the last selling price acts as a strong support level for a stock. A price falling below this level may not be a suitable choice for investment.
  7. Three Types of Patterns: Gann theory can be applied to identify and interpret three main types of patterns in trading: Time Study, Price Study, and Pattern Study. While the effectiveness of Gann’s approach remains questionable, it serves as an important step in recognizing and understanding patterns in trading.

These rules provide a framework for traders to explore and potentially incorporate aspects of Gann’s methodology into their trading strategies, always with a critical and cautious approach due to the speculative nature of Gann’s work.

Post a comment

Leave a Comment

Your email address will not be published. Required fields are marked *

×Close