Coding a Pivot Point Trading Calculator

As the name suggests, single candlestick patterns consist of a single Japanese candlestick formation.

Japanese candlestick formations consisting of just one candlestick are commonly known as single candlestick patterns. These patterns can be utilized to help traders predict potential price reversals in financial markets.

Single candlestick patterns can be traded independently and are classified into three main types, each with a bullish and bearish version:

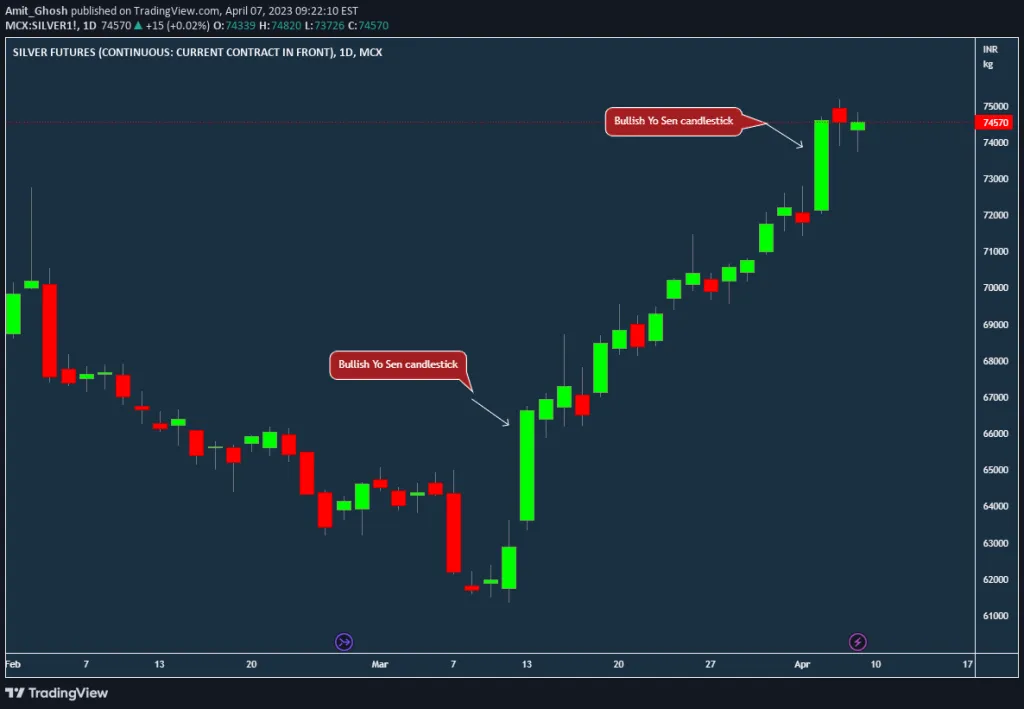
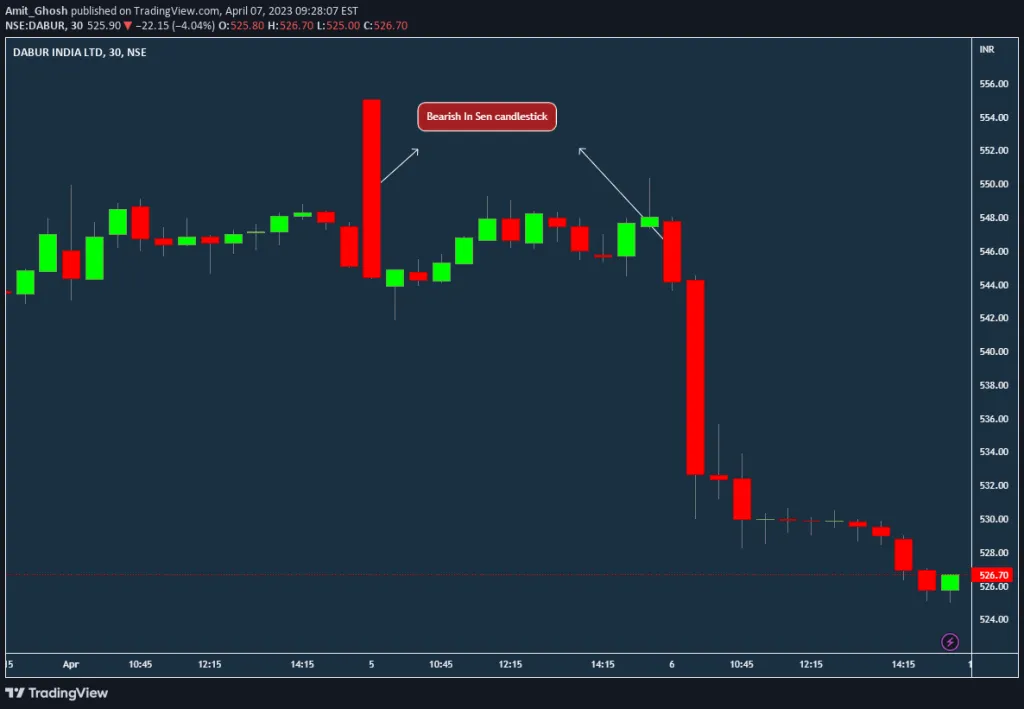
  • Yo Sen (bullish) and In Sen (bearish)
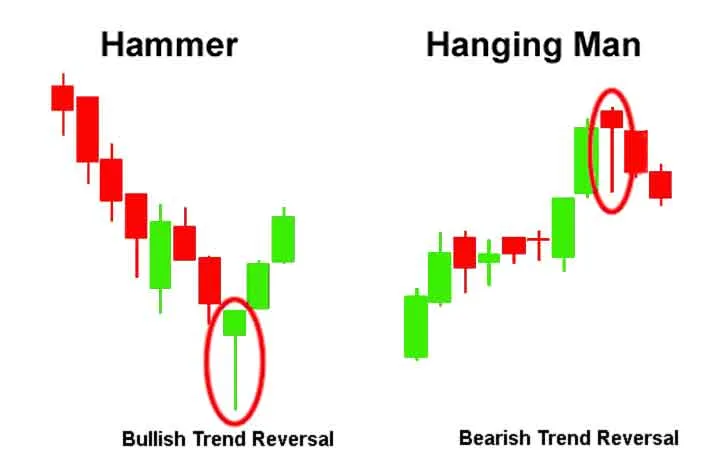
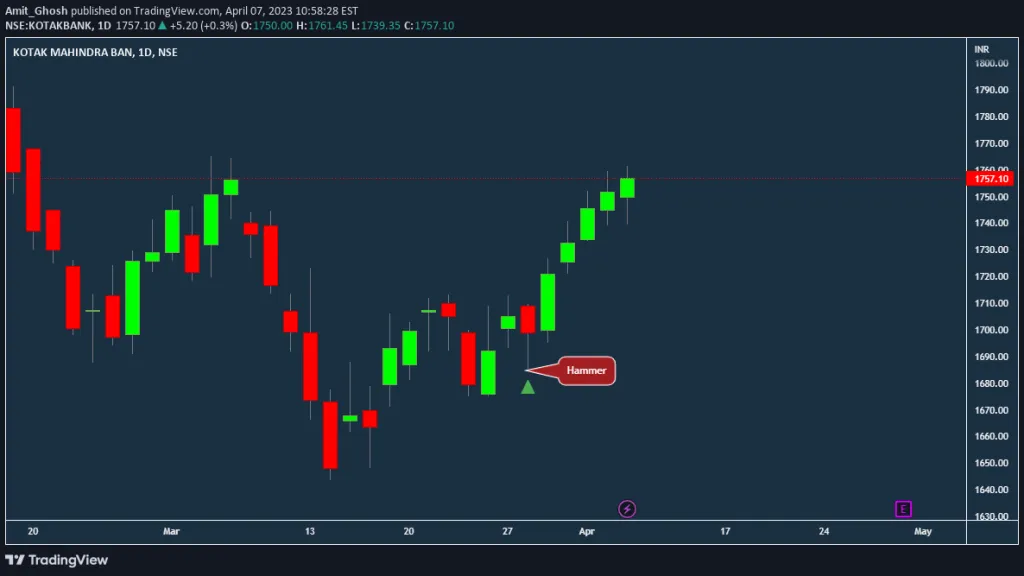
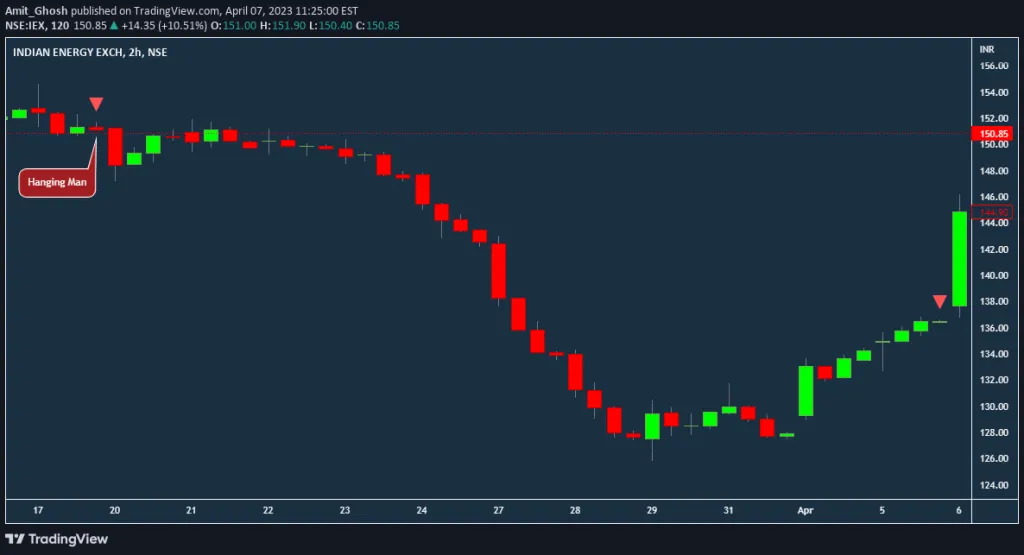
  • Hammer (bullish) and Hanging Man (bearish)
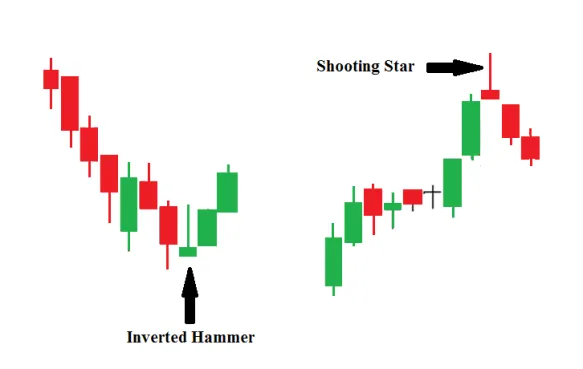
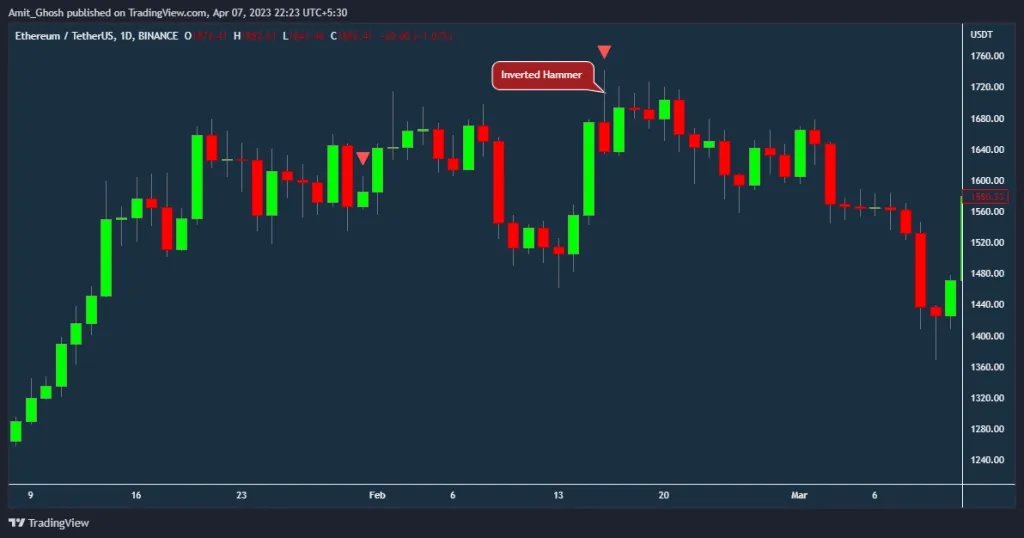
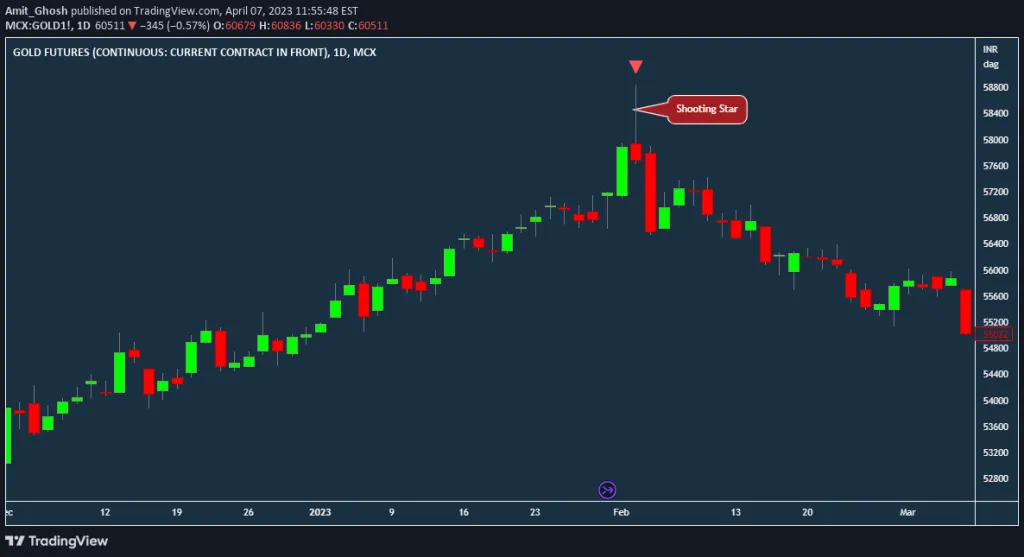
  • Inverted Hammer (bullish) and Shooting Star (bearish)

These patterns can be used to predict potential price reversals or continuations depending on the observed pattern. For instance, a bullish hammer pattern may indicate a potential price reversal, while a bullish inverted hammer pattern may suggest a continuation of the trend. 

Yo Sen candlestick

A bullish Yo Sen candlestick is represented by a single candlestick with a full body and short or non-existent wicks, indicating an upward trend and a potential buying opportunity. 

The following chart illustrates the appearance of a bullish Yo Sen candlestick.

In Sen candlestick

The bearish In Sen candlestick is identified by a single candlestick with a full body and short or non-existent wicks, indicating a downward trend and a potential selling opportunity.

The following chart illustrates the appearance of a bearish In Sen candlestick on a price chart.

Hammer and Hanging Man Patterns

Hammer and Hanging Man candlesticks look identical but have different signals and occur in different conditions.

  • They feature a small body at the top and a long wick at the bottom, with no wick above the body.
  • The body’s color is insignificant. So Red hammer, Green hammer – all are same.

Hammer Candlestick

A Hammer candlestick appears during a falling market trend, signaling a possible trend reversal towards an upward trend.

It indicates that the downtrend may have hit its bottom limit, providing a buying opportunity for traders.

The chart below displays how a Hammer candlestick looks on a chart.


Hanging Man Candlestick

If this type of candlestick appears during a price uptrend, it is referred to as a Hanging Man. 

It suggests that the upward trend may have reached its peak and that prices may be preparing to turn downwards. It signals a potential selling opportunity. 

The following image demonstrates the appearance of a Hanging Man candlestick on a chart:


Inverted Hammer and Shooting Star patterns

  • The Inverted Hammer and the Shooting Star candlesticks are often confused with each other, but they have different implications for traders.
  • Both of these candlesticks have a small body at the bottom and a long wick at the top that is two or three times longer than the body.
  • Neither of them have a wick below the body.
  • The color of the body is not significant in either case.

Inverted Hammer Candlestick

An Inverted Hammer candlestick pattern is identified when prices are falling. It suggests that the downtrend may have reached its lowest point and that prices may soon reverse upwards. This pattern indicates a potential buying opportunity.

A chart displaying the Inverted Hammer candlestick pattern is shown below for reference.

Shooting Star Candlestick

An Inverted Hammer candlestick pattern is identified when prices are falling. It suggests that the downtrend may have reached its lowest point and that prices may soon reverse upwards. This pattern indicates a potential buying opportunity.

A chart displaying the Inverted Hammer candlestick pattern is shown below for reference.

Post a comment

Leave a Comment

Your email address will not be published. Required fields are marked *

×Close