Pivot Points

Pivot points are a technical analysis indicator used to determine key levels the price may face support or resistance. They provide a framework for day traders to identify potential entry, exit, and stop-loss levels. Originating from the pre-computer era of floor trading, these calculations allowed traders to quickly establish important price points for the current trading day based on the previous day’s price action.
This lesson covers:
- The mathematical foundation of various pivot point types.
- A step-by-step calculation guide.
- How to interpret pivot levels for trading decisions.
- Core trading strategies using pivots in Indian markets.
- Common pitfalls to avoid when using this tool.
What are Pivot Points?
Pivot points are calculated levels that act as predictive indicators of support and resistance. Unlike moving averages or oscillators that are lagging indicators, pivots are static for the entire trading session. They are calculated at the start of the trading day using the open, high, low, and close from the previous period (most commonly, the previous day).
The primary level is the Pivot Point (PP) itself, which represents a point of equilibrium or the main “pivot” for the session. From this PP, several levels of support (S1, S2, S3…) and resistance (R1, R2, R3…) are projected.

These levels are watched by a large number of market participants, from retail traders to institutional desks. This widespread attention can make them self-fulfilling; when many traders place buy or sell orders at the same pivot levels, the price is more likely to react at those points.
How Pivot Points are Calculated
There are several methods for calculating pivot points, each with its own nuances. The “Standard” or “Floor Trader” pivots are the most common. Let’s review the formulas for the most popular types. In all formulas, H, L, C, and O refer to the High, Low, Close, and Open of the previous period.
1. Standard (Floor Trader) Pivots
This is the most widely used method. The calculation begins with the base Pivot Point (PP).
The support and resistance levels are then calculated off the PP.
2. Woodie’s Pivots
Woodie’s pivots place a stronger emphasis on the previous period’s closing price.
The R1 and S1 levels are calculated differently as well:
R2 and S2 are calculated using the same formula as Standard pivots.
3. Camarilla Pivots
Camarilla pivots use the previous day’s close and range to calculate a tighter set of 8 levels (4 resistance, 4 support). They are valued for identifying short-term range and breakout trades.
The key levels for Camarilla are often considered to be L3 and H3 for range trading, and L4 and H4 for breakout trades.
Calculation Example (Standard Pivots)
Let’s calculate the daily pivot points for NIFTY 50 based on a hypothetical previous day’s data:
- High (H): 19,850
- Low (L): 19,700
- Close (C): 19,820
Step 1: Calculate the main Pivot Point (PP)
Step 2: Calculate Support and Resistance Levels
Here are the calculated levels for the day:
| Level | Price (Rs.) |
|---|---|
| Resistance 2 (R2) | 19,940 |
| Resistance 1 (R1) | 19,880 |
| Pivot Point (PP) | 19,790 |
| Support 1 (S1) | 19,730 |
| Support 2 (S2) | 19,640 |
How to Read and Use Pivot Points
The interpretation of pivot points provides a structured way to view the market’s sentiment for the day.
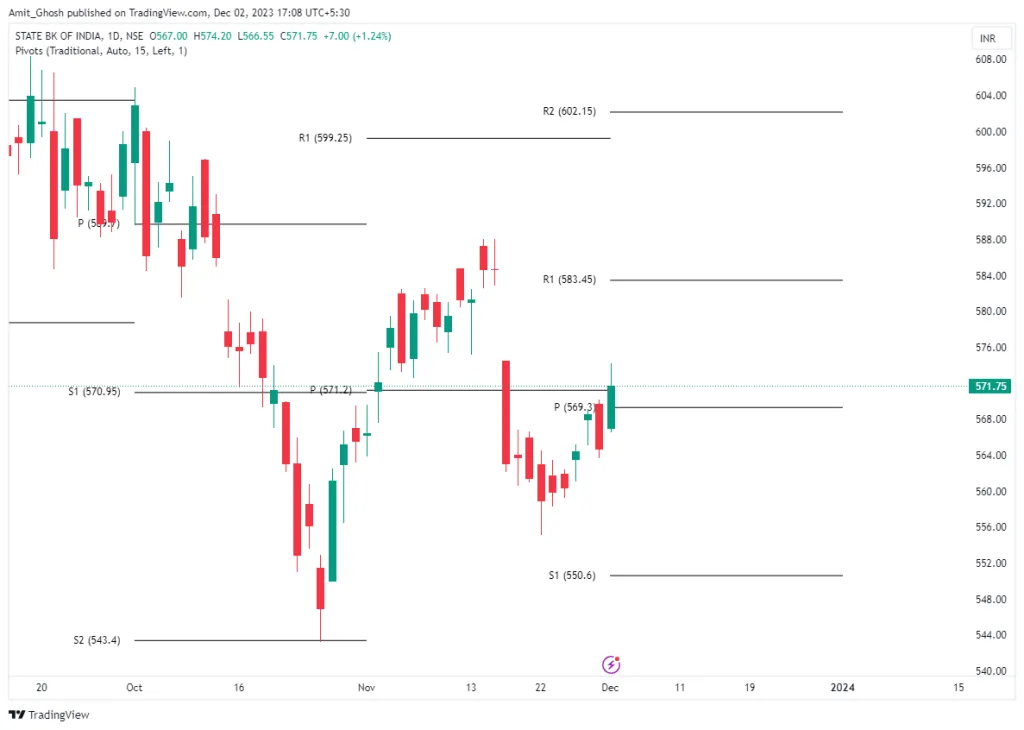
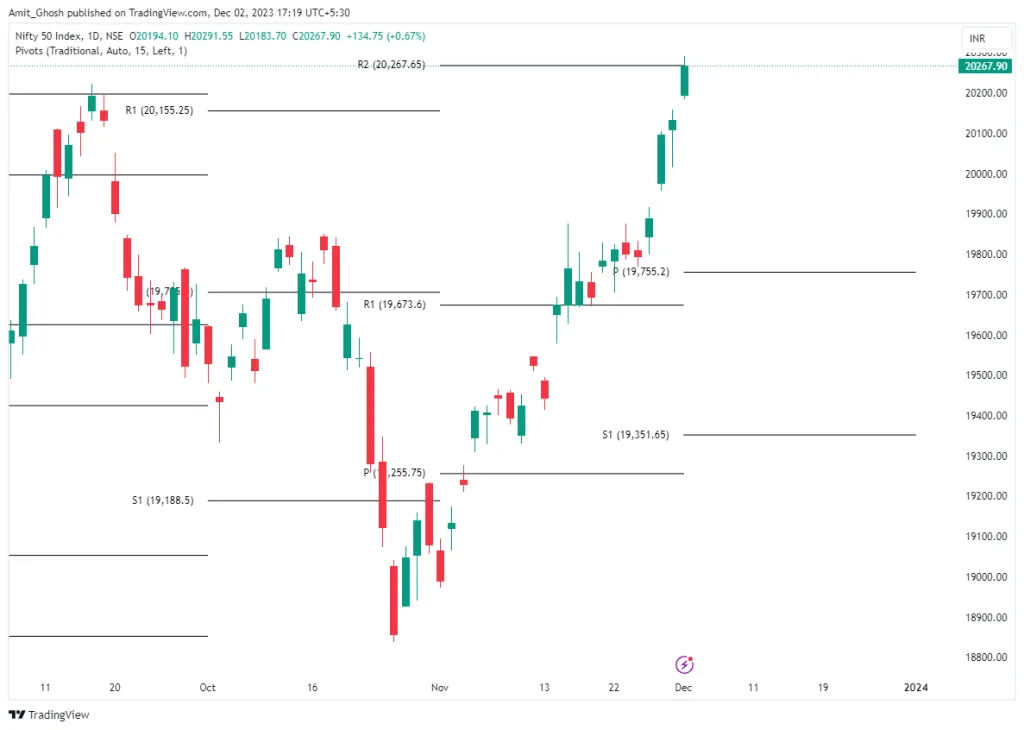
- Market Bias: If the market opens and trades above the main Pivot Point (PP), the bias for the day is generally considered bullish, and traders may look for long opportunities. Conversely, trading below the PP suggests a bearish bias, favoring short positions.
- Support and Resistance: The R1, R2, and R3 levels are seen as sequential resistance points. As price approaches them, buying pressure may wane. S1, S2, and S3 are support levels where selling pressure may decrease.
- Role Reversal: A fundamental principle of support and resistance applies here. Once a resistance level like R1 is decisively broken, it can turn into a support level for subsequent price action. Similarly, a broken S1 can become resistance.
Trading Strategies with Pivot Points
Pivots can be used for a variety of trading approaches.
1. Pivot Level Breakouts
This momentum strategy involves entering a trade when the price decisively breaks through a key pivot level, typically R1 or S1.
- Long Entry: Enter a buy order when the price moves firmly above R1, with a stop-loss placed below R1. The first target would be R2.
- Short Entry: Enter a sell order when the price moves firmly below S1, with a stop-loss above S1. The first target would be S2.
2. Pivot Level Reversals
This range-bound strategy involves fading price moves at support or resistance. It is best used in non-trending, sideways markets.
- Long Entry: If the price falls to S1 or S2 and shows signs of rejection (e.g., a bullish pin bar or hammer), a trader might go long, expecting a bounce back towards the PP.
- Short Entry: If the price rises to R1 or R2 and shows rejection (e.g., a bearish engulfing pattern), a trader might go short, targeting the PP.
3. Using Pivots for Profit Targets
Pivots offer logical and objective price targets. This removes the guesswork from deciding when to exit a trade. For example, if you enter a long trade at the PP, a logical first profit target is R1, and a second target is R2.
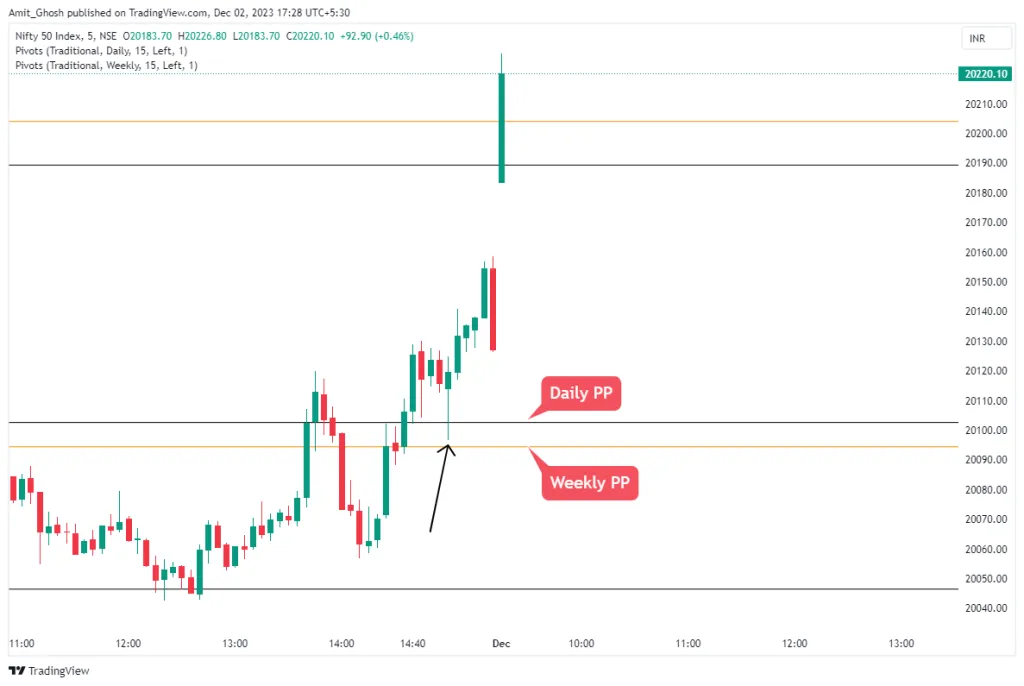
The Power of Confluence
Pivot points become significantly more reliable when they coincide with other technical indicators. This is known as “confluence.” The more reasons there are to take a trade at a specific level, the higher the probability of success.
Examples of confluence include:
- A daily R1 level lining up with a weekly R1 level.
- A daily S1 level coinciding with a 50-period moving average.
- Price reaching an R2 level while the RSI indicator is in the overbought territory (>70).
- A strong pin bar candlestick pattern forming exactly at a pivot level.
As shown in the chart above, when a daily and weekly pivot coincide, the resulting support/resistance zone is much stronger.
Best Timeframes for Indian Markets
The choice of pivot period depends on your trading style:
- Intraday Trading (5-min, 15-min charts): Daily pivots are the standard. They provide relevant levels for trading sessions on NIFTY, BANKNIFTY, and liquid F&O stocks.
- Swing Trading (1-hour, 4-hour, Daily charts): Weekly pivots are more suitable. They give a broader view of potential turning points over several days.
- Positional Trading (Weekly charts): Monthly pivots can help identify major long-term support and resistance zones.
Conclusion
Pivot points are a time-tested tool for identifying key intraday levels of support and resistance. By calculating them from the previous period’s data, they provide a forward-looking map of potential market turning points. While they can be powerful, their real strength lies in confluence—combining them with other forms of technical analysis to build a high-probability trading setup. Whether used for setting entries, stops, or targets, pivot points bring a valuable layer of objective structure to any trading plan.