The Fractal Indicator

Systematic Trading with The Fractal Indicator
Pre requisite: https://unofficed.com/topic/quantifying-swings/
In this section, You will learn –
- What a fractal indicator is.
- What is an up fractal and down fractal looks like in your chart.
- What you need to look for to confirm a completed fractal.
- How to determine the market direction with fractals.
- How to use fractals to place your stop loss.
Example 1:
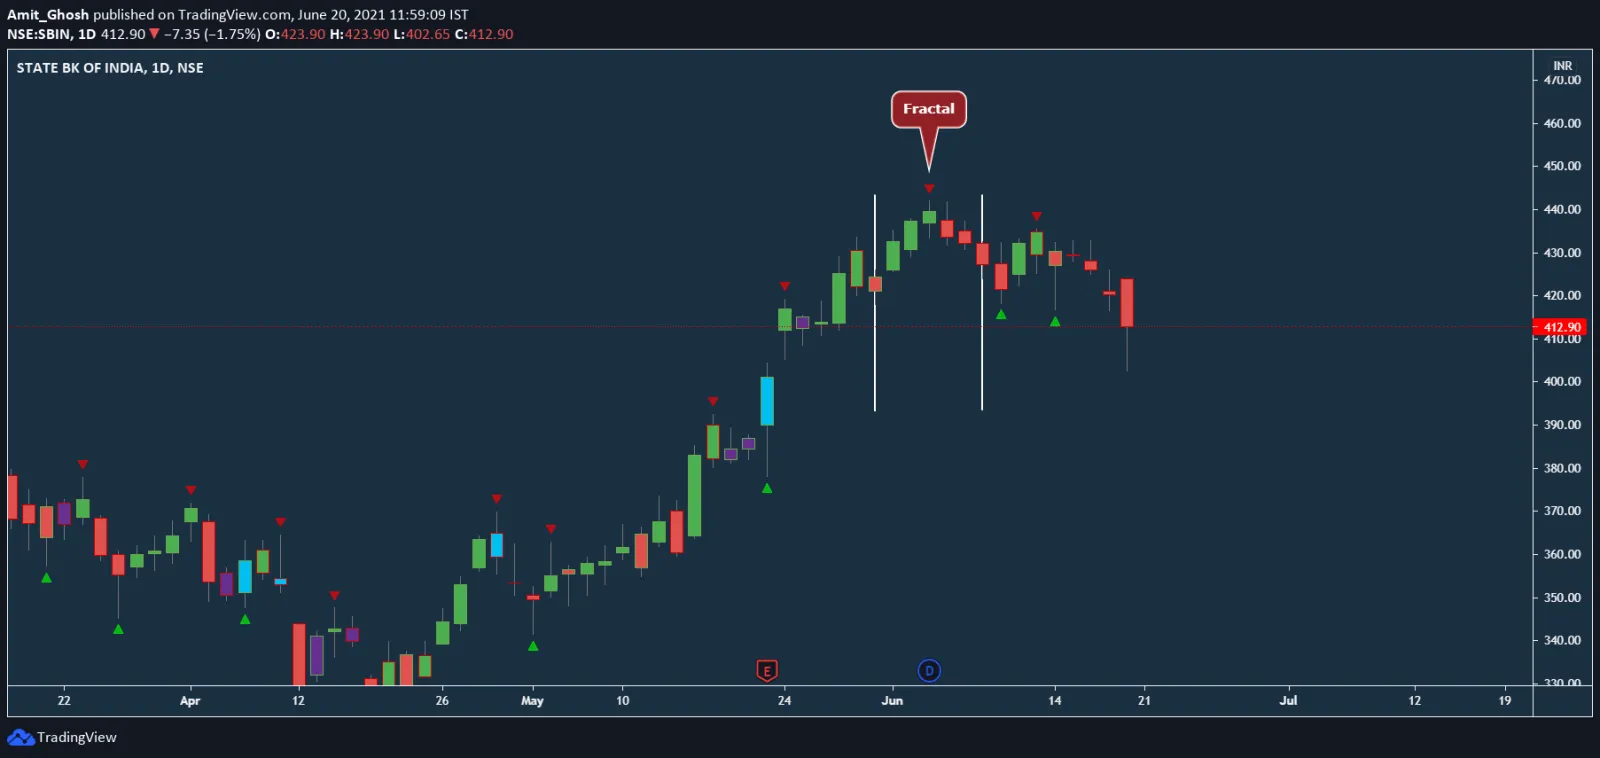
Between the white lines, there are 5 candles.
- It is used to identify reversal points in the market.
- It indicates if the price has struggled to move higher or lower.
As a trader, You can use fractals to get an idea of the potential direction a price can move in.
There are two types of fractal –
- Up Fractal
- Down Fractal
An Up Fractal is formed when the middle candle is the highest point in the five candle pattern.
- There are two candles on the left side with lower highs (Their highs are lower than the middle candle’s high.)
- There are two candles on the right side with lower highs
Connection with Bounce Theory:
As You can see, The peak in the Bounce Theory is called an Up Fractal.
Fractal Indicator Formula
The high of nth candle will be considered Peak or Up Fractal in a said time frame if –
- The high of the (n-2)th candle is lower than the high of the nth candle.
- The high of the (n-1)th candle is lower than the high of the nth candle.
- The high of the (n+1)th candle is lower than the high of the nth candle.
- The high of the (n+2)th candle is lower than the high of the nth candle.
Simplifying –
For an Up Fractal, We use the following formulas:
- High(n)>High(n−2) and
- High(n)>High(n−1) and
- High(n)>High(n+1) and
- High(n)>High(n+2)
For a Down Fractal, We use the following formulas:
- Low(n)<Low(n−2) and
- Low(n)<Low(n−1) and
- Low(n)<Low(n+1) and
- Low(n)<Low(n+2)
n represents the high or the low of the current candlestick.
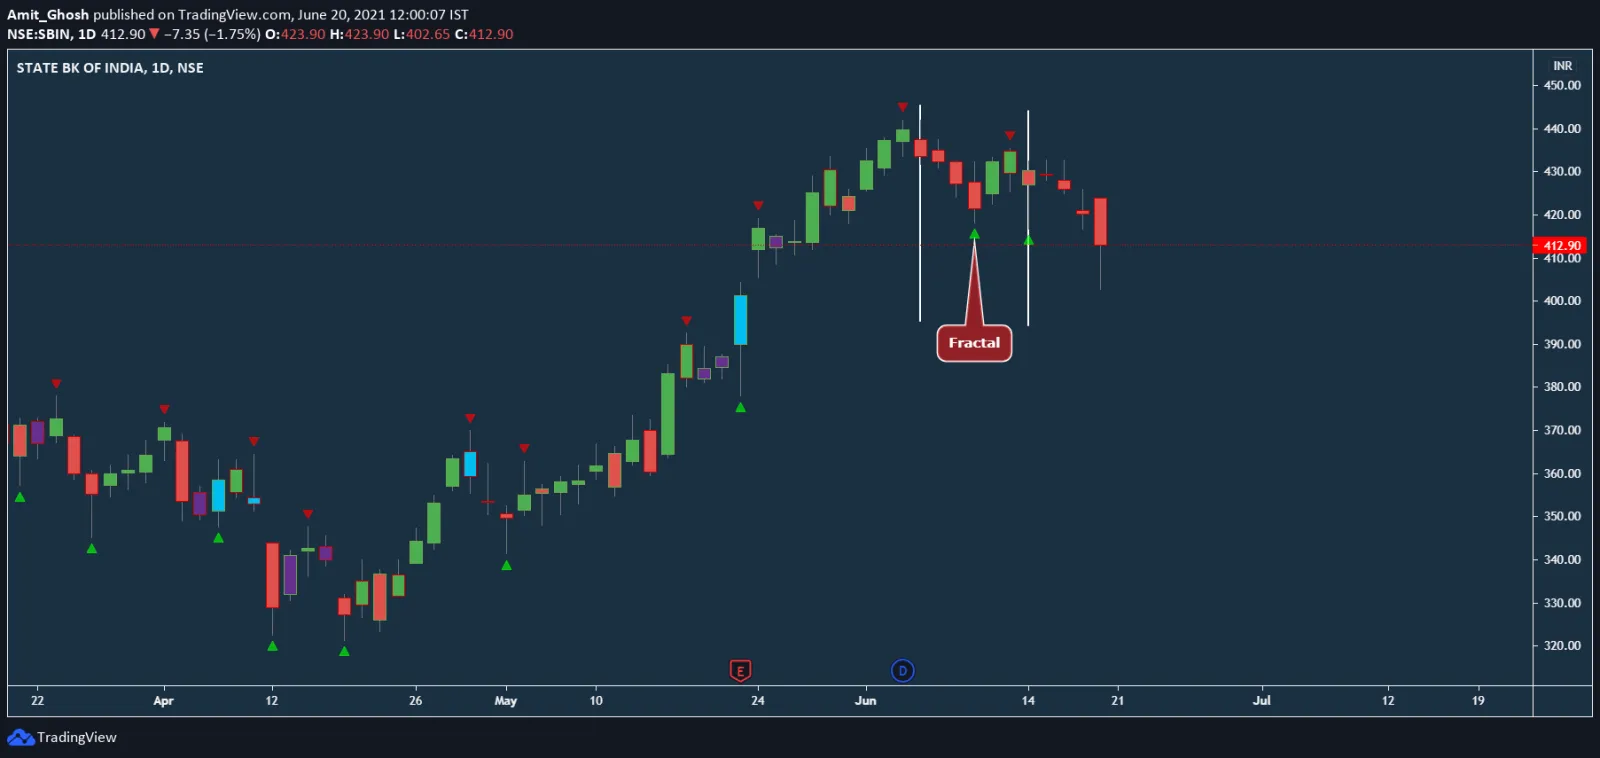
The Down Fractal is the opposite of the Up Fractal.
The Down Fractal is formed when the middle candle has the lowest point in the five candle pattern.
- There are two candles on the left side with lower highs. (Lows higher than the central candle low.)
- And two candles on the right side with lows higher than the central candle low.
Note
Because the Fractal is a 5 candle pattern, the 5th candle must be completed and close before the fractal can be used to make any trading decision.
- This is because the price can move during the time that the fifth candle is forming.
- If price moves either above the higher high or below the lower low, while the pattern is still forming, the fractal setup is invalidated.
So you must wait for the pattern to complete in order to make sure that the fractal is confirmed.
Reference 1:
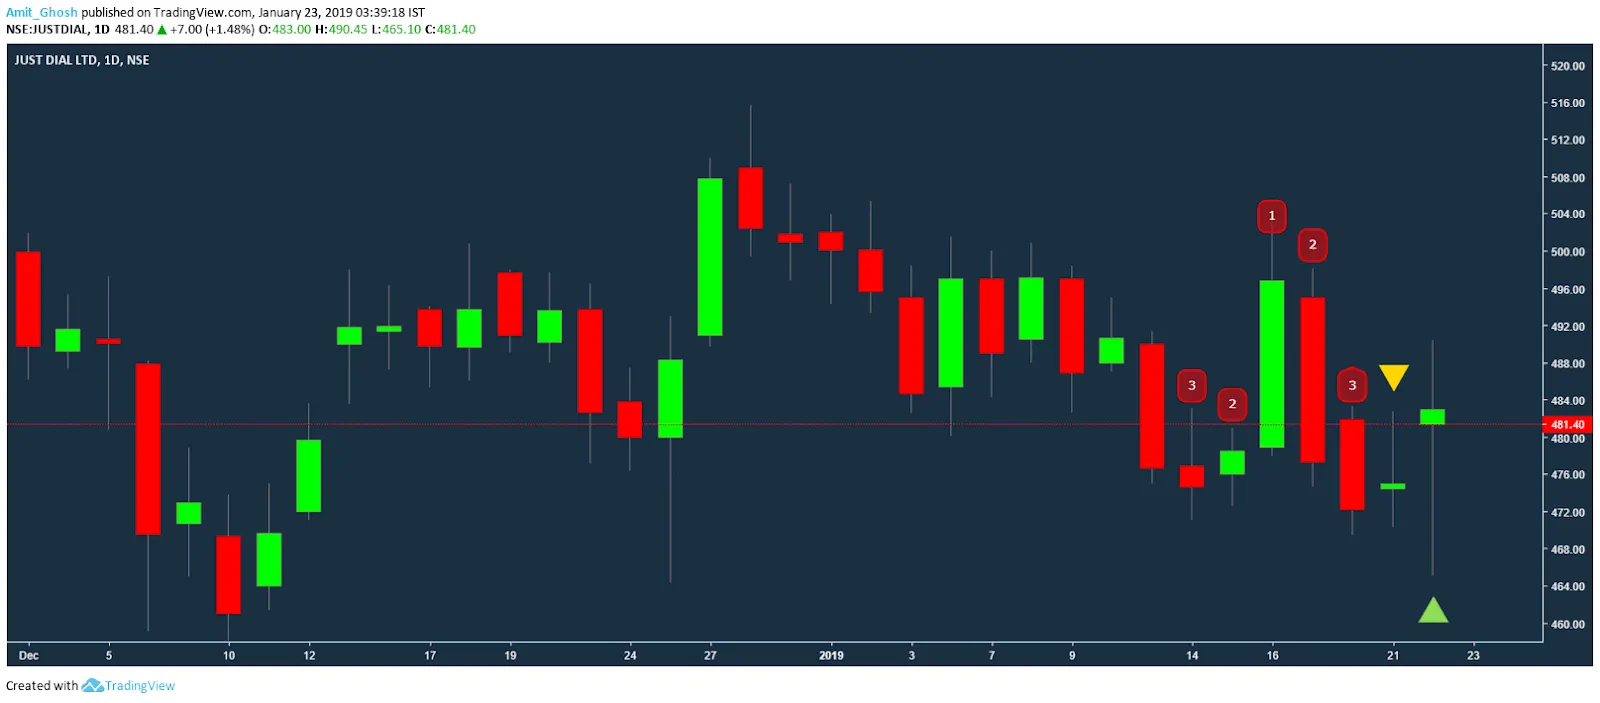
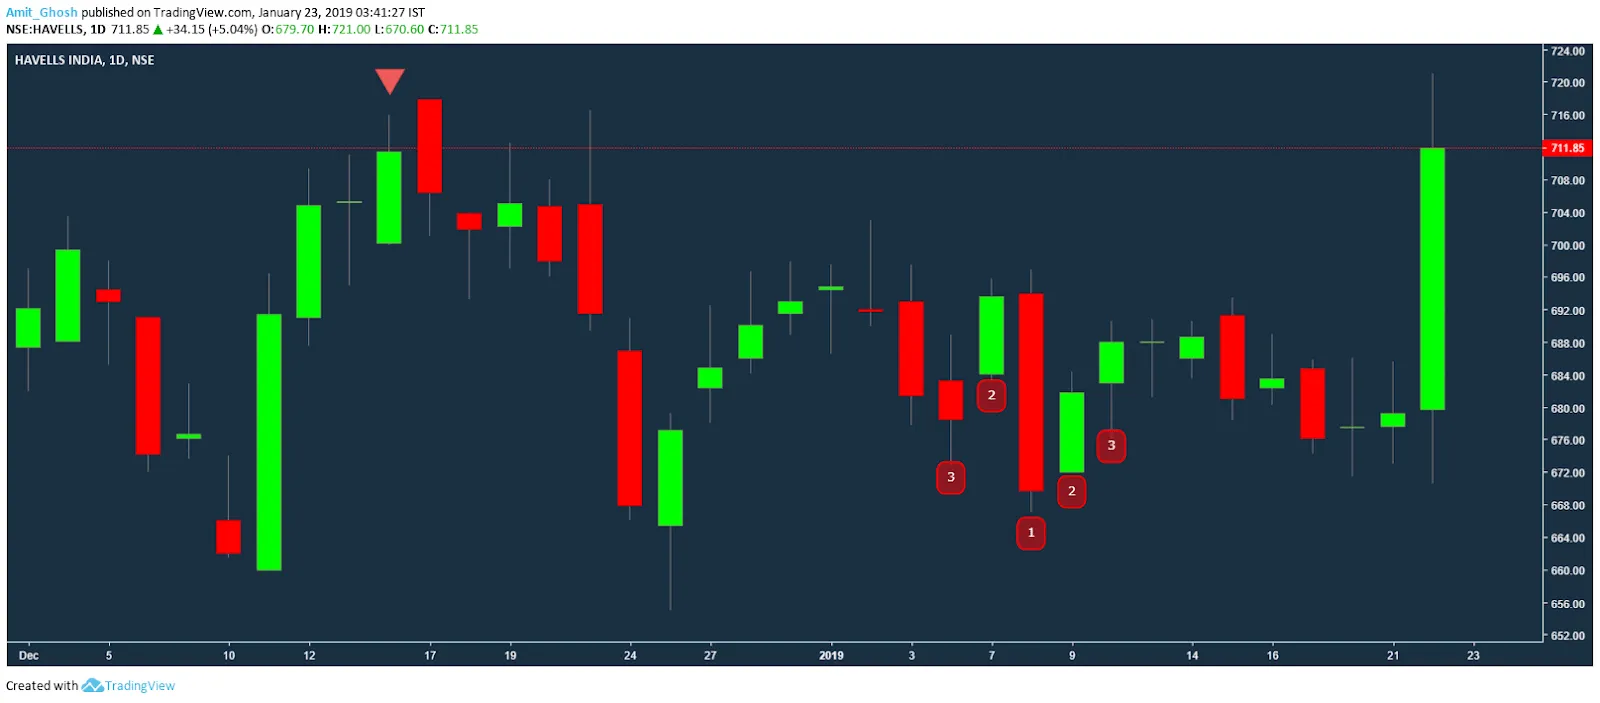
- 1 is referred to as the High or Low of the middle candle.
- 2 is referred to as the High or Low of the first neighbor candle.
- 3 is referred to as the High or Low of the far neighbor candle.
So, Re-Iterating,
- In the case of Up Fractal, 2 and 3’s high will be lower than 1’s high.
- In the case of Down Fractal, 2 and 3’s low will be higher than 1’s low.