Volume Profile Analysis on Bank Of India Futures

Here is another setup using Volume Profile Analysis on Bank Of India May Futures. To analyze this we need to move the chart across various timeframes and sell how the volume profile is changing.
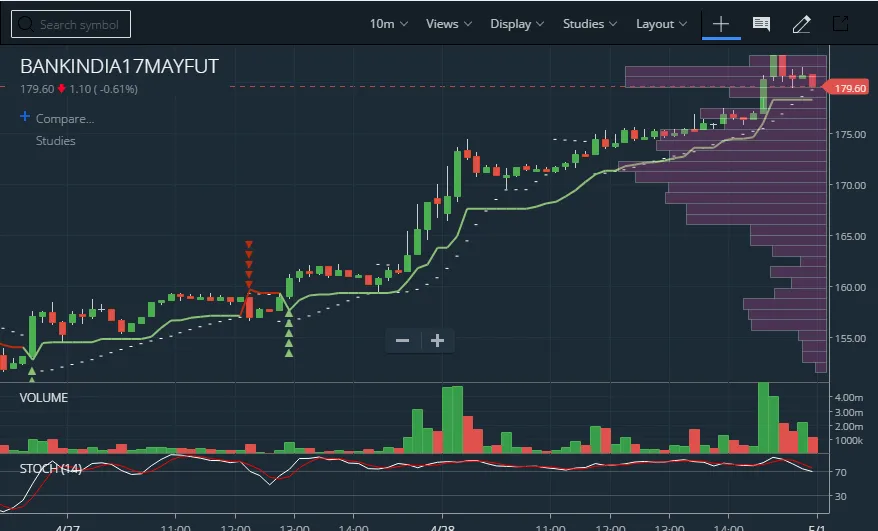
Here goes the 10M chart –
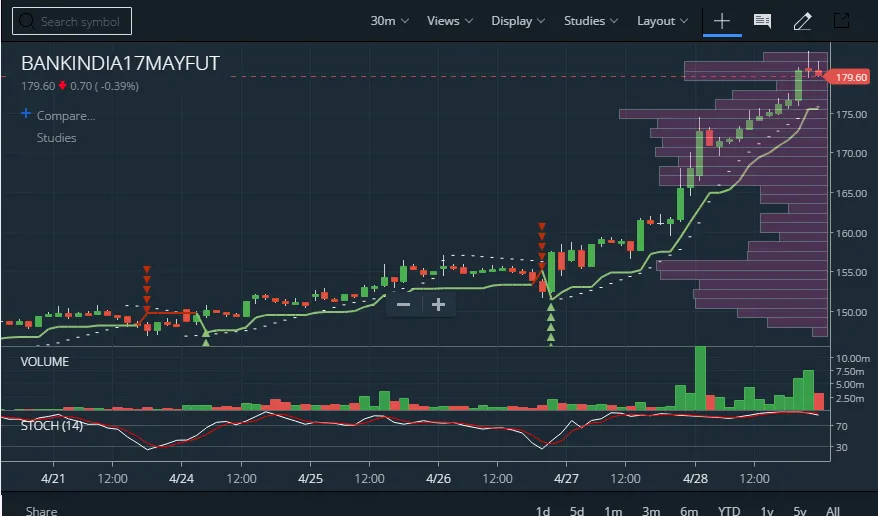
 Here goes the 30M chart –
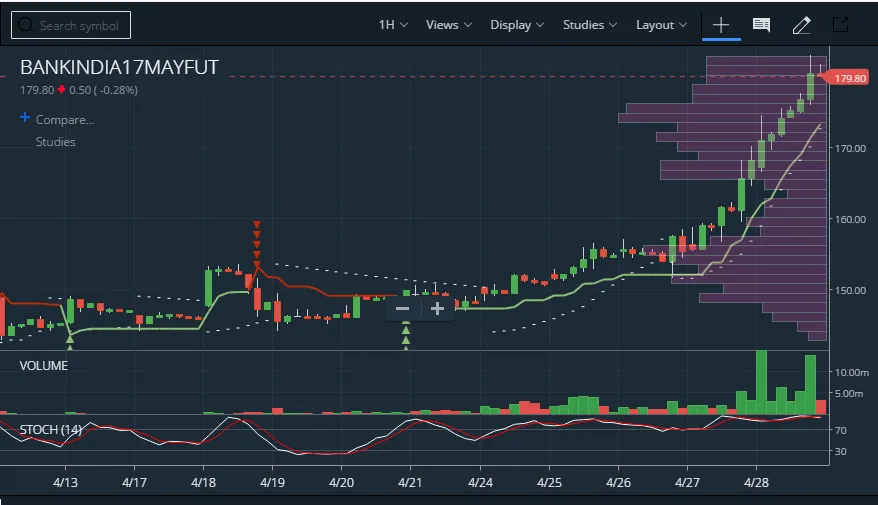
Here goes the Hourly chart –
Here goes the Daily chart –
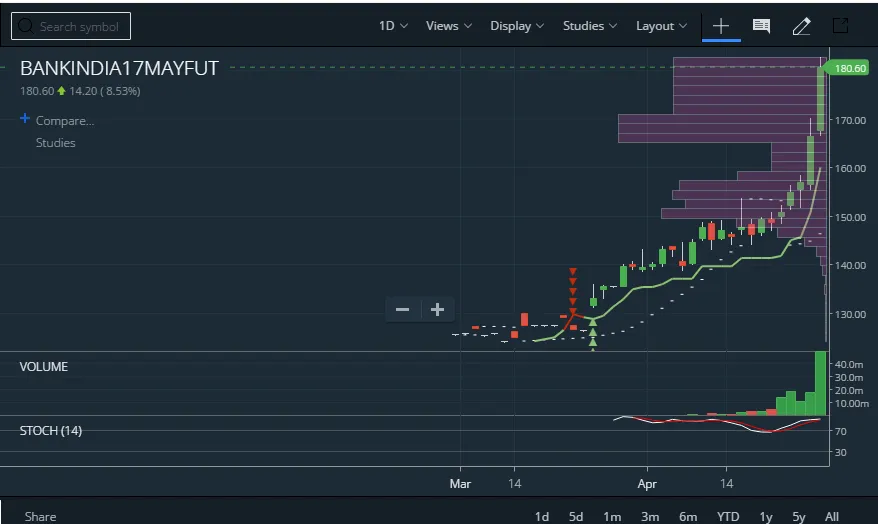
The levels for Bank of India are 147, 152, 156, 171, 180. Do have a look at how these levels are breached. This is how breakouts happen on volume profile.
It is recommended having a look at dynamic charts in Zerodha Kite or Tradingview.
If you see the 10M chart you can notice that the stock is on the rally but there are minor pullbacks for testing market depth. This is also called an intraday correction. This temporary imbalance is created because of profit booking of early profit bookers.
Put aside that whenever the levels of 146, 151, 156, 171, 180 are tested, the script is filling the gap. Volume profile fills the gaps that are thinly traded. They trade level to level and fill gaps in between.
The market is not built on prices, it’s made of people. People decide. The perception of it being heavily traded. That is what makes people hold. Once it does not hold, it will go lower or higher. It’s not compression.
Time compression talks about the situation where a trader has bought/sold a stock he will waiting to exit his position. Due to herd following mentality, people tend to exit at the same time. Our job here is to find such points and join the liquidation ride.
However, Volume Profile is even more basic than compression. Here people are compressed differently. It’s not with time; it is with perceptions. Volume Profile Analysis is not time compression; it is perception compression.
In Unofficed Chat, we have a channel dedicated to teaching perception compression. It’s called value congruence. Perception Compression happens the most when there is Value Congruence. Volume Profile Analysis just tells more about them.
So back to Bank of India. What happens tomorrow? Levels in BOI are 172.45, 176.8, 178.7, 180.5
It is trading above 180. If tomorrow 180 not get smashed, it will go up. Strong close is a big indication.
You need 178.7 and 176.8 soon or else Compression and Congruence will take it higher. A 30% OI increase backed by a pullback from 171 to 181 tells a lot about strength even in the new series.
But if BankNIFTY cracks, it can fall into 160S. Also, ICICI has results on Wednesday. So bad results will move it really bad. So rally from 171 – 181 can be a bull trap. But keep the levels in mind, you need a dip till 176 to create a panic which can push till 172.
There is a huge hollowness from 157 to 172. All hell will break loose if 172 is cracked.