Statistical Arbitrage in Indian Stock Market – Introduction

Statistical arbitrage, more commonly called Stat Arb, is based on the statistical mispricing of one or more assets compared to the expected future value of these assets.
Deterministic arbitrage, on the other hand, ensures a risk-free profit from being long in some securities and short on others.
Its a computational and quantitative approach to trading.
The Birth of Stat Arb can be dated back in the mid-1980s when a small group of researchers working under Nunzio Tartaglia in Morgan Stanley created a program to buy and sell stocks in pair combinations.
The program quickly earned a reputation along with great profits but the strategy was kept hidden for a while but soon the idea behind the strategy got revealed and is named as Pairs Trading.
A pair of stocks is identified based on fundamental or market similarities. Pair trade earns profits based on mean reversion, So it’s mostly the mean-reverting stocks. Commodities stocks will work great in this case.
In the pair of chosen stocks which generally behaves or is perceived to behave similarly in the market changes, one is priced over the mean and the other below the mean.
When the spread between two stocks is high, we short the outperforming stock and long the underperforming stock. It hedges the risk from the whole market movements.
Once the spread is closed, we do reverse trade. It most likely generates profit.
Now,
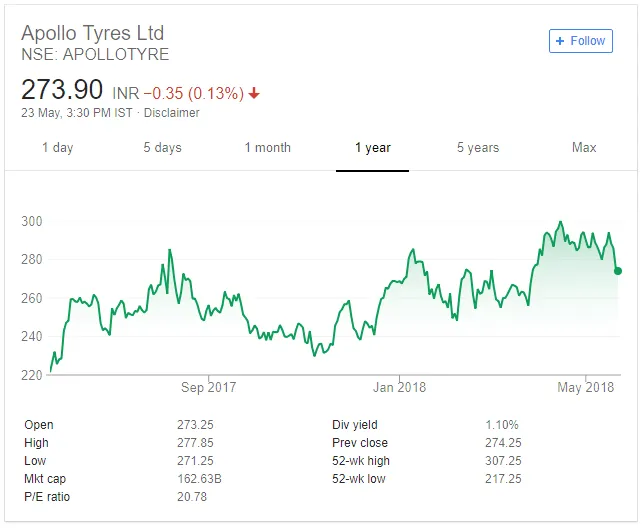
MRF and Apollo Tyres are two Indian companies whose underlying commodity is rubber and they move pretty synthetically. Both have good management. It is definitely correlated.
In the early 90s, the analysis techniques became more sophisticated and different models are made which are more technical than fundamental; this is when the term “Statistical Arbitrage” was first used.
Stat Arb considers a portfolio of a few hundred or more stocks which have to carefully match by region and sector to minimize the exposure to various risk factors.
Let’s see the basic steps in implementing a Star Arb Strategy on a universal set of stocks.
- Select a universal set of stocks which are traded in exchange.
- Filter them into subsets of region and sector. Cointegrated stocks are mean-reverting.
- Rank the subset – Each stock is given a rank. Higher scores indicate buy orders. Lower scores indicate sell orders.
Which means –
Underperforming stocks will receive higher scores (~ Long) and Outperforming stocks will receive lower scores (~Short).
After ranking the subset, along with the top x% and short the bottom x% of this ranked subset.
Based on the risk-taking capacity of the system. The number x will be decided. The lower the number, the higher the chance of winning.
In short,
The higher ranked stocks are expected to rise in value, we will go along the top x per cent and the lower-ranked stocks are expected to fall in value, so we short the bottom x per cent.
Finally Rebalancing on some frequency is needed. Rebalancing is an important aspect of managing of a portfolio of stocks, it will not have much of an impact on the volatility and returns but it can have a large impact in terms of trading costs and taxation.
Like we can propose a sell-off pre 31st March only to buy few of them later on for tax-loss harvesting. The optimal frequency of rebalancing depends on the assets in the portfolio and must be carefully evaluated to minimize the risk.
MRF and Apollo Tyres shared above are an example of a good fundamental pair. Let’s talk about the tyre stocks when as MRF and Apollo Tyre fell into our discussion.
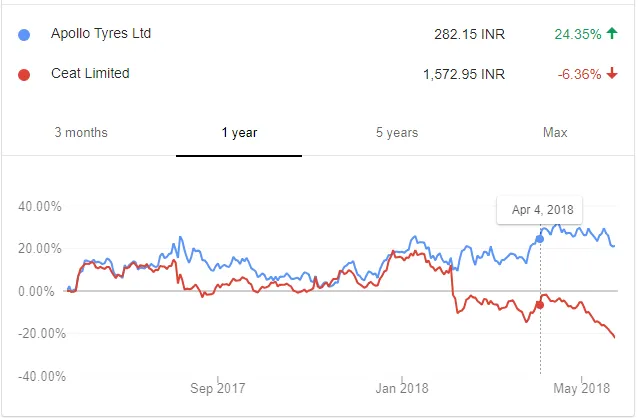
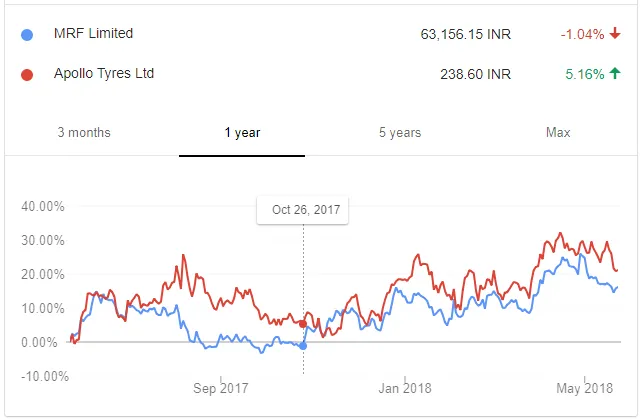
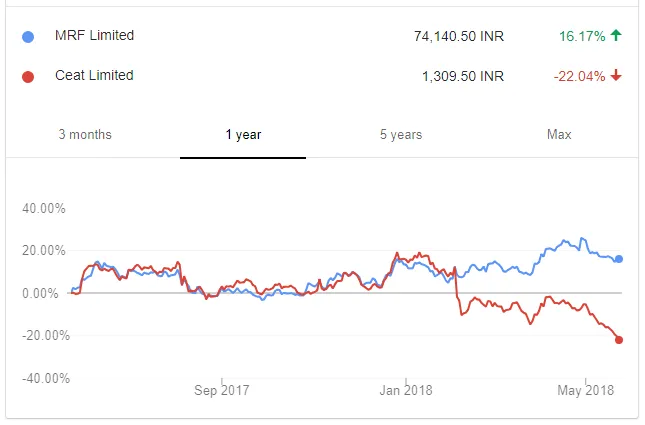
The above three images tell the cases with Apollo, Ceat and MRF. Ceat is not at all confirming any pattern with the other two companies. It used to confirm. But definitely, a fundamental shift has been spotted.
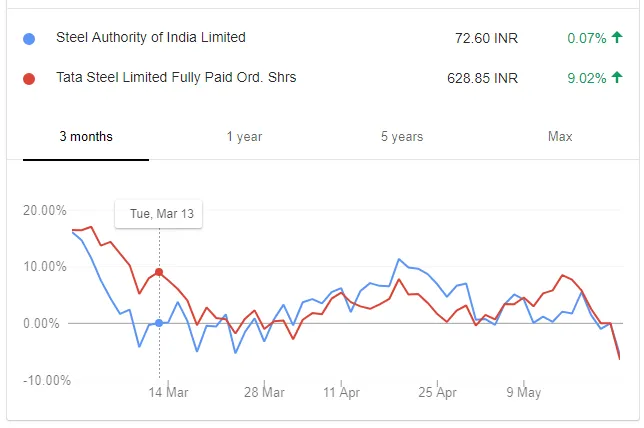
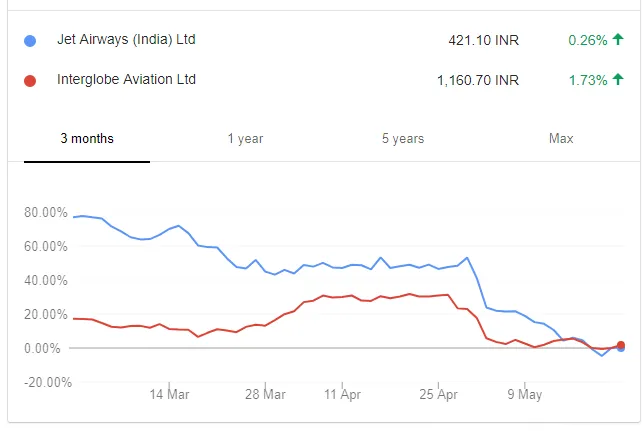
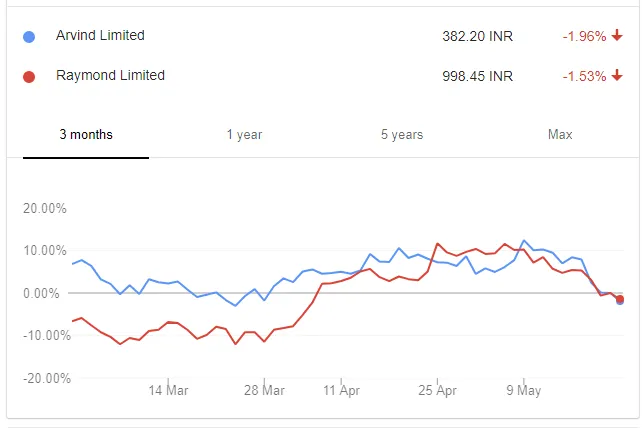
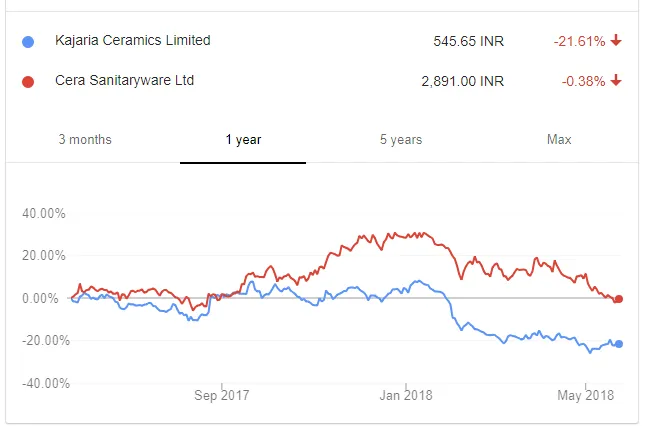
The tool used here is Google Finance; they have a lovely comparison chart.
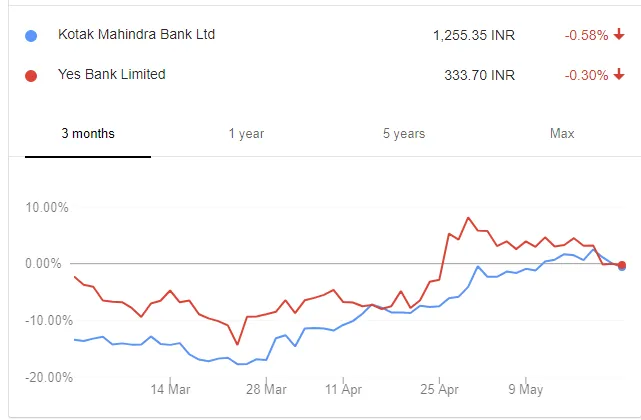
Without going into further details, let’s say from the image of Kajaria Ceramics and Cera Sanitaryware; that it is the correct time to sell Cera Sanitaryware and buy Kajaria Ceramics.
But it is a rough hunch. Let’s focus on the rest of the chapters.
Summarizing,
What type of stocks makes good pairs?
The best stocks to use in Stat Arb are those where there is a fundamental reason for believing that the spread is mean-reverting.
Typically this means that –
- The stocks are in the same market sector.
- The stocks are from the same promoter group.
- The stocks are from the same company (some companies have A and B shares with different voting rights or trade on different exchanges).
Cross-sector groups work too –
- Airlines vs Crude Oil
- Gold mines vs Gold
In short,
- The security is not mispriced. It’s just an arbitrage.
- It often uses data-mining methods to uncover past patterns that form the basis for investment positions.
- It doesn’t involve only 2/3 instrument like we have seen the above examples. It has vast application.
- Electronic communication networks have made it easy to capitalize on such opportunities.
- When the spread between the two stocks widens, go long the underperforming stock and short the overperforming stock.
Define a good pair
Upon coming up with a good fundamental stock pairing you next need to have a mathematical test for determining if it’s a good pair.
The most common test is to look for cointegration (http://en.wikipedia.org/wiki/Cointegration) as this would imply that the pair is a stationary pair (the spread is fixed) and hence statistically it is mean-reverting.
There is a test for checking cointegration named P-value (http://en.wikipedia.org/wiki/P-value) hypothesis test; It gives a value which can be considered as a level of confidence in the pair being mean-reverting.
excellent