Flag Patterns: Part II- Identify bull or bear flag pattern
How to identify Bull or Bear Flag patterns
Classic Bull Flag Pattern
Classic Bear Flag Pattern
Classic Bull Flag Pattern
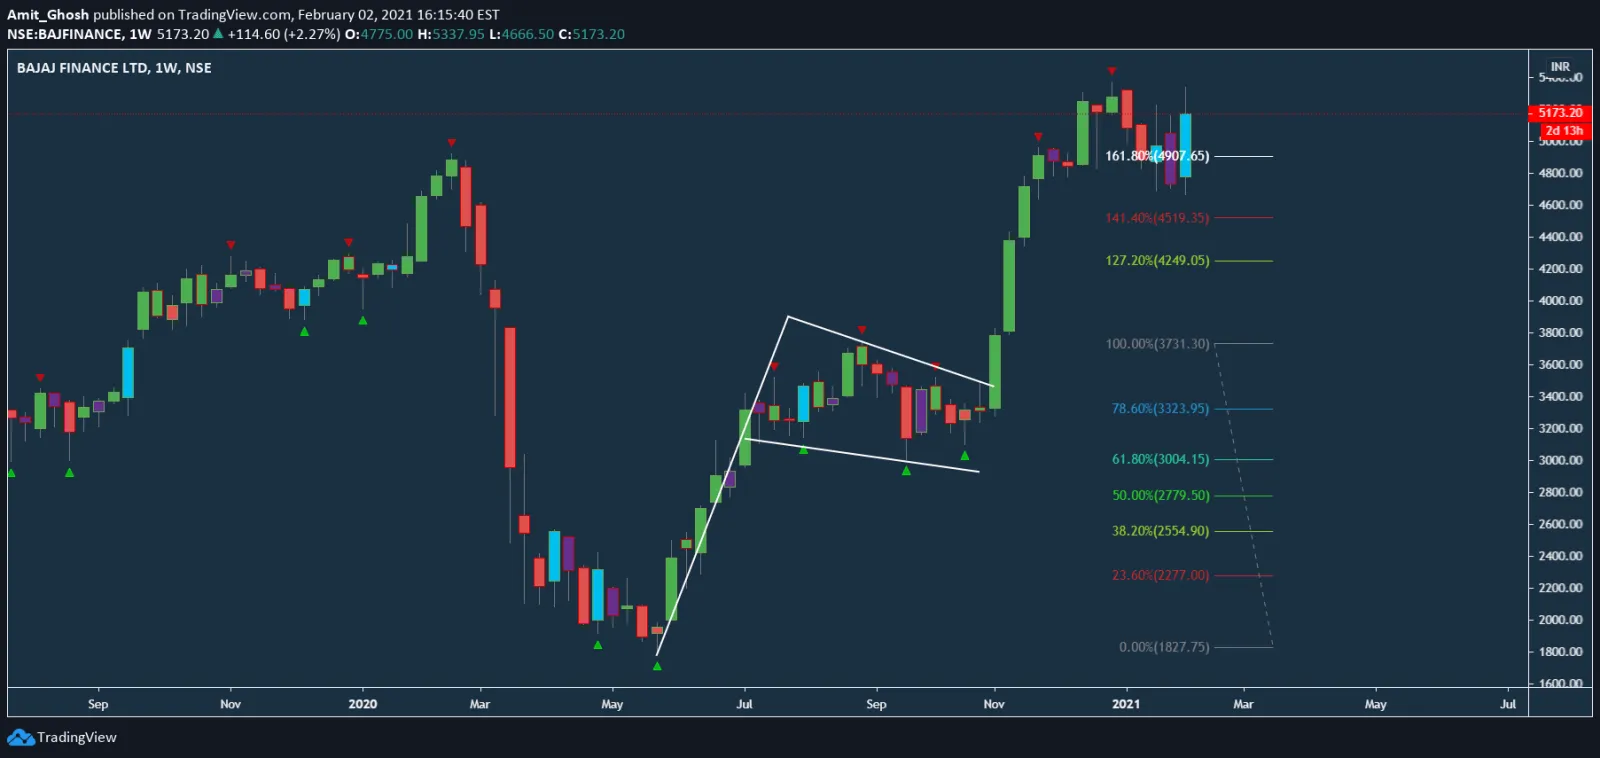
In this chart, As You can see Bajaj Finance follows a 50% retracement after a strong uptrend.
It consolidates within a rectangular range which is sloped downwards.
This is an example of a Classic Bull Flag Pattern.
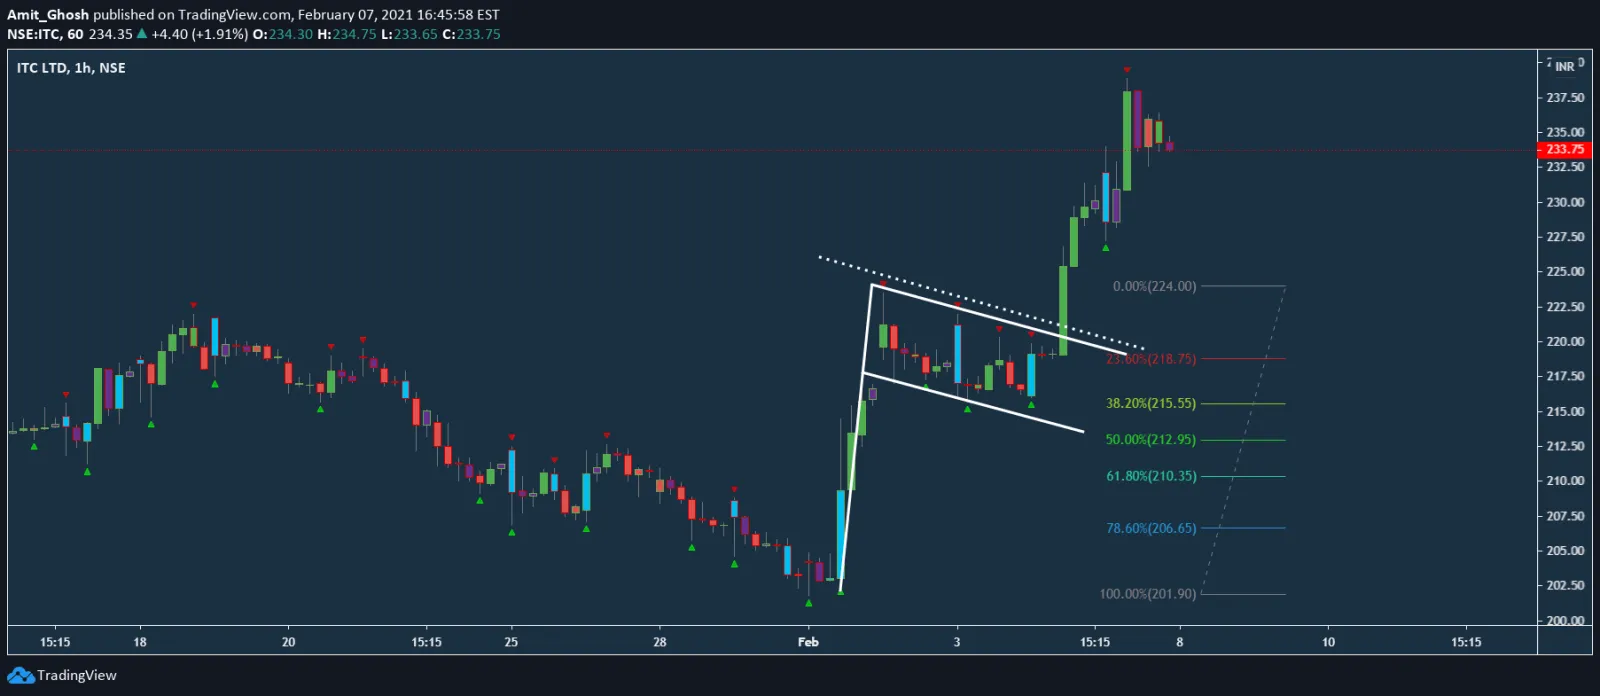
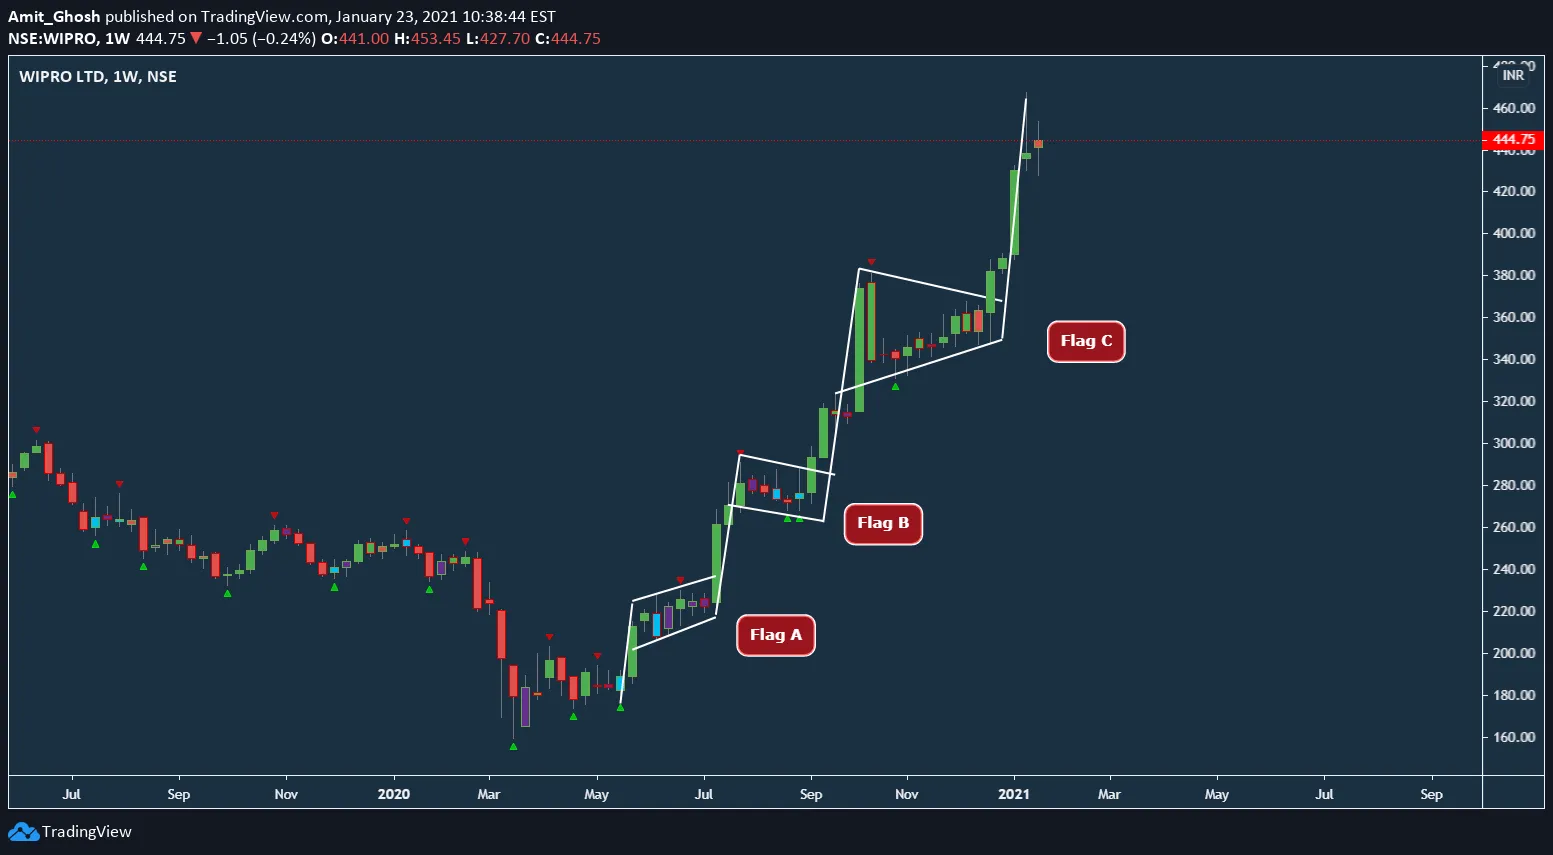
Here is another example of ITC but with a smaller timeframe and again, with 50% retracement.
In this case, We can study multiple Flags within one single chart.
So, after making a range, it is expected to break out of that range continuing the uptrend.
This is why it is called a continuation pattern. The Classic Bull Flag Pattern is giving us the opportunity to enter the uptrend in the middle of the trend occurrence.
Classic Bear Flag Pattern
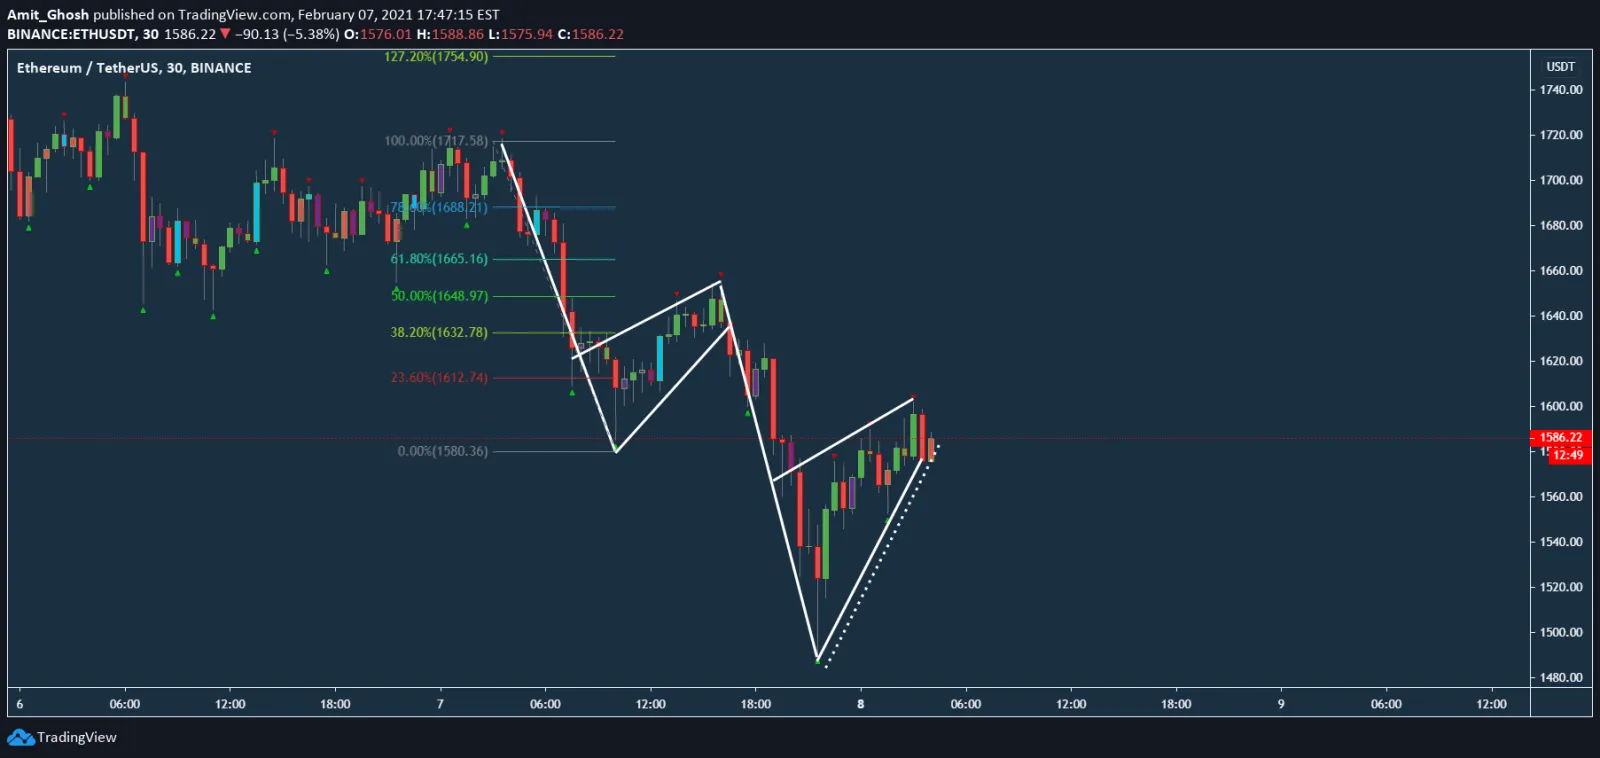
Similarly, In the Classic Bearish Flag Pattern, exactly the opposite thing happens!
It consolidates within a rectangular range which is sloped upwards.
Strangely, in this ETHUSDT chart, We can see it has done 50% retracement before breaking the range and continuing the downtrend.