Standard Deviation Indicator

In this lesson, you will learn:
- What the Standard Deviation indicator is and its role in measuring market volatility.
- The mathematical formula behind the Standard Deviation indicator.
- A step-by-step guide on how to calculate Standard Deviation.
- How to interpret high and low readings of the indicator for trading decisions.
- Practical trading strategies that use Standard Deviation to identify opportunities.
- How adjusting the indicator’s settings can affect its sensitivity and signals.
Understanding the Standard Deviation Indicator
The Standard Deviation indicator is a fundamental statistical tool applied to financial markets to measure volatility. In simple terms, it quantifies how much the price of an asset has deviated from its recent average price. A high Standard Deviation value implies that prices have been swinging widely, indicating high volatility. Conversely, a low value suggests that prices have been stable and trading within a tight range, indicating low volatility.
It is a crucial component of many other indicators, most notably Bollinger Bands, which are set at two standard deviations above and below a simple moving average. However, when used as a standalone indicator, it provides a direct gauge of market volatility, helping traders anticipate the potential magnitude of future price moves.
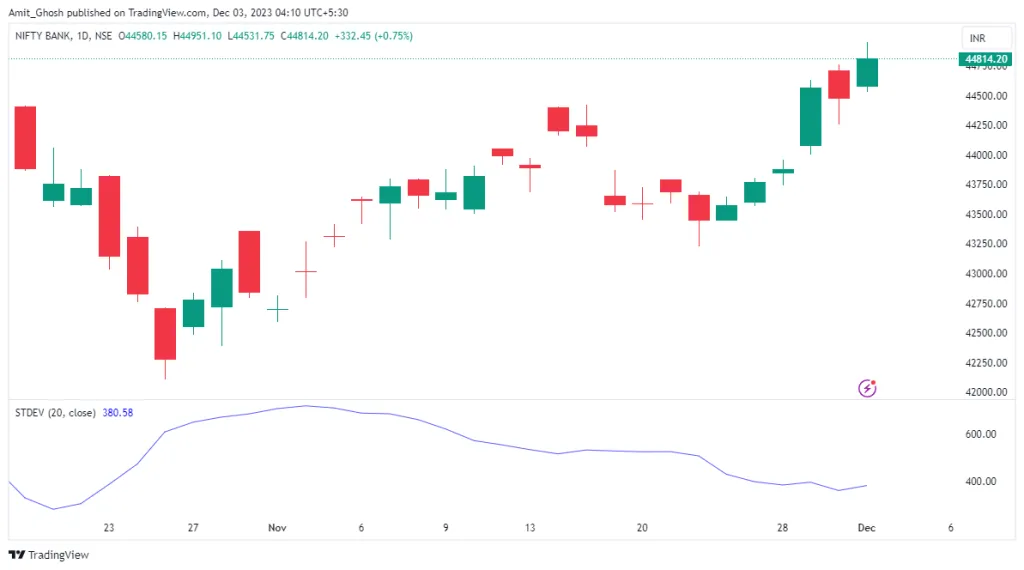
On a chart, the indicator is typically plotted as a single line in a separate pane below the price. This line rises and falls, giving a visual representation of expanding and contracting volatility.
The Mathematical Formula
Standard Deviation is a precise statistical measure. For a given lookback period ‘n’, the calculation involves several steps. The default period for most trading platforms is 20.
First, we calculate the simple moving average (SMA) of the closing prices for the period ‘n’.
Where:
- is the closing price of the i-th period.
- is the lookback period.
Next, we calculate the variance. This is the sum of the squared differences between each closing price and the SMA, divided by the number of periods.
Finally, the Standard Deviation () is the square root of the variance.
This value is what is plotted as the Standard Deviation indicator line on the chart.
How to Calculate Standard Deviation (A 5-Period Example)
Let’s walk through a simplified example with a 5-period lookback period (n=5). Assume the closing prices for the last 5 periods were: 100, 102, 101, 103, and 104.
| Step | Action | Calculation | Result |
|---|---|---|---|
| 1 | Calculate the 5-period SMA | (100 + 102 + 101 + 103 + 104) / 5 | 102 |
| 2 | Find the deviation of each price from the SMA | (100-102), (102-102), (101-102), (103-102), (104-102) | -2, 0, -1, 1, 2 |
| 3 | Square each deviation | (-2)^2, (0)^2, (-1)^2, (1)^2, (2)^2 | 4, 0, 1, 1, 4 |
| 4 | Sum the squared deviations to get the variance | (4 + 0 + 1 + 1 + 4) / 5 | 2.0 |
| 5 | Take the square root of the variance | sqrt(2.0) | 1.414 |
The Standard Deviation for this 5-period window is 1.414. This is the value that would be plotted for the current bar.
How to Read the Standard Deviation Indicator
Interpreting the indicator is straightforward:
- Rising Line: Volatility is increasing. Price swings are becoming wider. This often occurs during strong trends or major market news.
- Falling Line: Volatility is decreasing. The market is becoming quieter and prices are trading in a narrower range. This is typical of consolidating or ranging markets.
- High Value: The indicator reaches a peak after a significant price move (either up or down). A high value suggests that the recent price action has been unusually volatile compared to the lookback period. This is often interpreted as a sign that the current move may be exhausted and a period of lower volatility (consolidation) is likely to follow.
- Low Value: The indicator troughs at a very low level, indicating a period of extreme quietness and price compression. This is often seen as a precursor to a significant breakout, as low volatility periods are typically followed by high volatility periods. This is the “calm before the storm.”
High Standard Deviation Scenario
A high reading on the indicator signals that the market has recently experienced a large price move. This suggests that volatility is at an extreme and is likely to revert to its mean. In practical terms, after a large trend move, the market often enters a period of consolidation or correction. A trader might see a high SD reading as a signal to tighten stops or take profits on a trend-following trade, as the momentum might be fading.
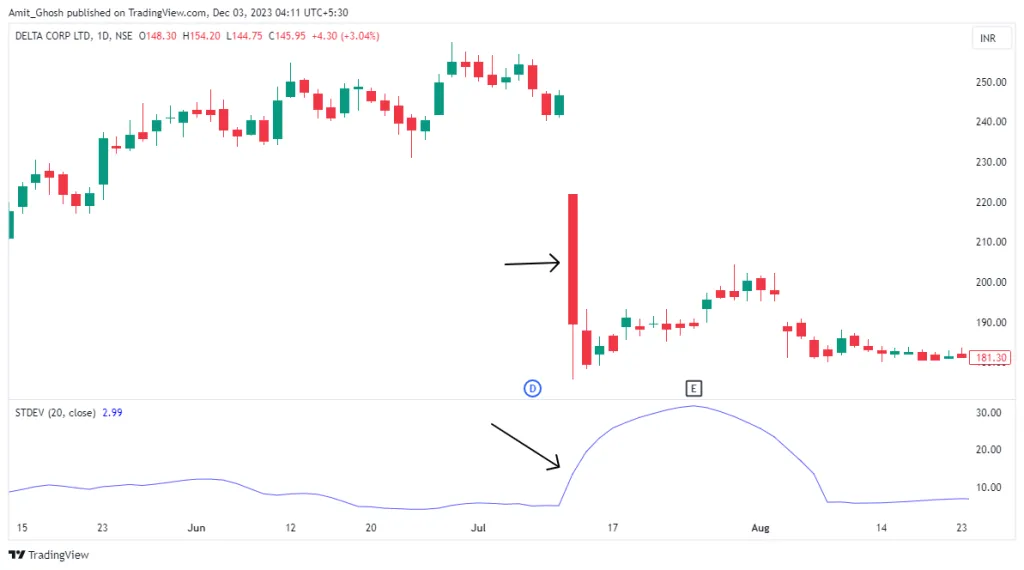
In the chart above, the shaded area highlights a period of significant price movement. Note how the Standard Deviation indicator below peaks during this phase, signalling an expansion of volatility.
Low Standard Deviation Scenario
An extremely low standard deviation reading indicates a market that is consolidating tightly. This period of low volatility often precedes a significant price expansion. Traders watch for these “squeeze” conditions to position themselves for a potential breakout. A low SD value is a warning that a large move is likely imminent. This is the core concept behind strategies like the Bollinger Band Squeeze (which is based on Standard Deviation).
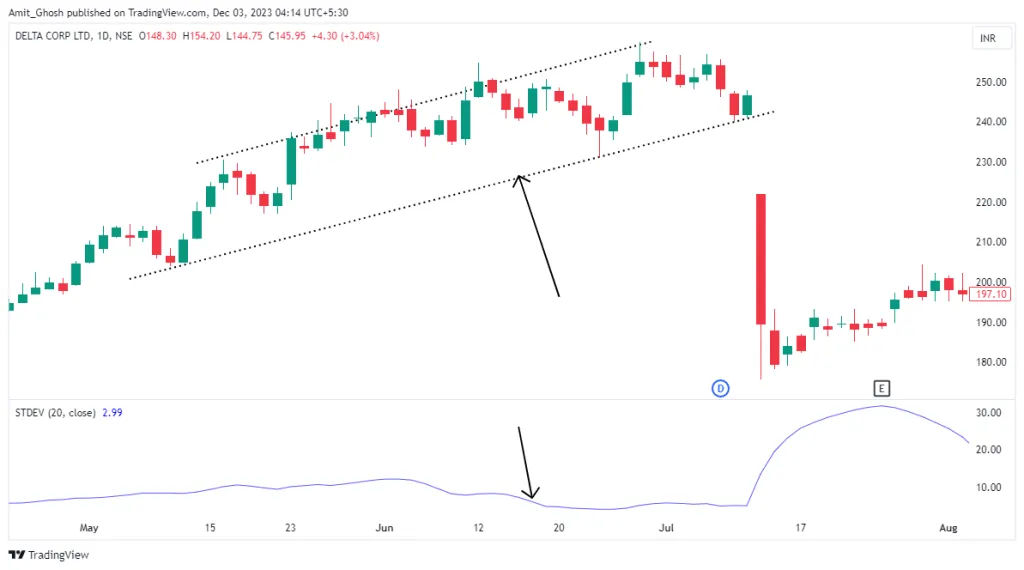
The chart above shows a period where the price is range-bound. The Standard Deviation indicator is at a very low level. This quiet period is followed by a sudden, powerful breakout, as the stored energy is released.
Trading Uses of the Standard Deviation Indicator
The Standard Deviation indicator is rarely used for direct buy or sell signals. Instead, it serves as a filter or a setup condition for other strategies.
- Volatility Squeeze Breakouts: This is the most common use. Wait for the Standard Deviation to fall to a multi-period low (e.g., a 6-month low). This identifies a “squeeze.” When the price breaks out of the consolidation range, traders can enter in the direction of the breakout, expecting an explosive move.
- Setting Profit Targets and Stop-Losses: In a trending market, you can use a multiple of the Standard Deviation (similar to Bollinger Bands or Keltner Channels) to set dynamic profit targets or trailing stop-losses.
- Mean Reversion Strategies: When the Standard Deviation reaches an extreme high and price is far from its moving average, mean-reversion traders might look for signs of exhaustion. They anticipate that both price and volatility will revert back towards their respective means.
- Confirming Trend Strength: A rising Standard Deviation along with a rising price (in an uptrend) confirms that the trend is strong and backed by momentum. A rising price accompanied by a falling Standard Deviation (a divergence) may suggest the trend is losing momentum and could be nearing an end.
Changing the Period Settings
The default setting for this indicator is 20 periods. Adjusting this can have a significant impact on its behaviour.
- Longer Period (e.g., 40): Increasing the lookback period makes the indicator smoother and less sensitive to short-term price fluctuations. It will produce fewer, but potentially more significant, signals of extreme volatility.
- Shorter Period (e.g., 10): Decreasing the lookback period makes the indicator more reactive and “spiky.” It will register high and low volatility levels more frequently, but this can also lead to more false signals.
For most systematic strategies, the standard 20-period setting provides a reliable balance. Traders should backtest thoroughly before using a non-standard setting.
Best Timeframes for Indian Markets
In the context of the NSE, the Standard Deviation indicator is particularly useful on daily and hourly timeframes for NIFTY, BANKNIFTY, and large-cap stocks. On these timeframes, periods of low volatility compression (the “squeeze”) often lead to clean, powerful breakouts that are actionable for swing and intraday traders. On lower timeframes (e.g., 5-minute), the indicator can become noisy and less reliable for identifying major volatility shifts.
Conclusion
The Standard Deviation indicator is an indispensable tool for any serious trader focused on volatility. It provides a clear, quantitative measure of how active or quiet a market is.
Key takeaways include:
- Standard Deviation measures the dispersion of price data around its average, directly quantifying volatility.
- Low readings signal low volatility and a potential “squeeze,” often preceding a major price breakout.
- High readings signal high volatility, suggesting a recent price move may be exhausted and due for consolidation.
- It is a non-directional indicator; it tells you how much the market is moving, not which way.
- Its primary use in trading is to identify low-volatility setups ripe for a breakout, and to act as a confirmation tool for trend strength or potential exhaustion.
By understanding how to read and apply the Standard Deviation indicator, you gain a deeper insight into the market’s rhythm, allowing you to better time your entries and anticipate significant price movements.