The Gator oscillator
The Gator Oscillator
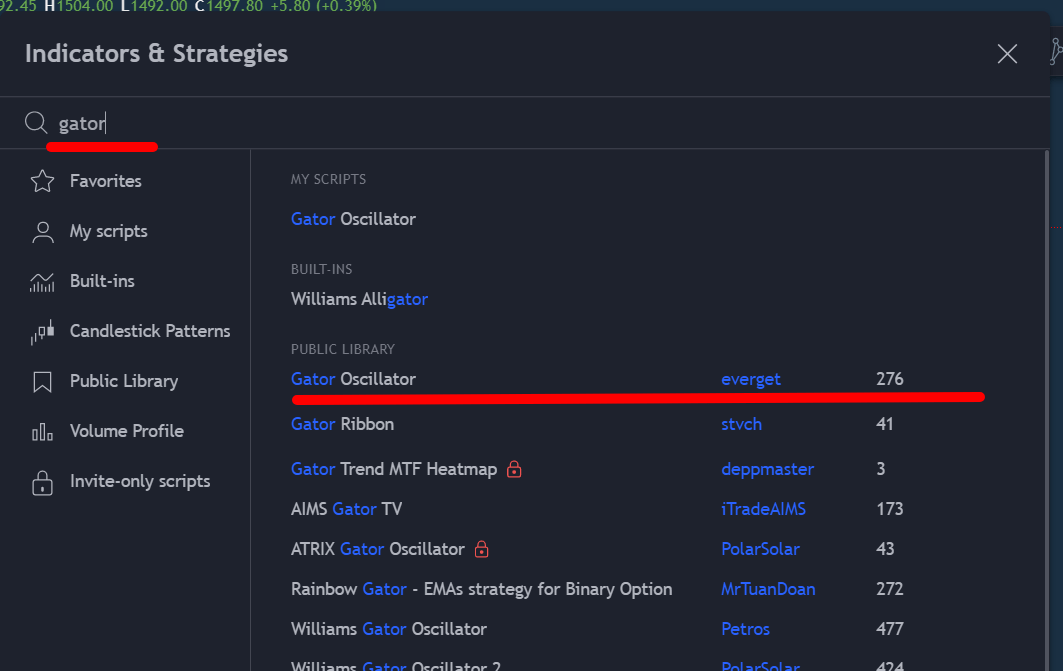
The Gator oscillator is very similar to the Alligator indicator in that it helps detect trend changes in an asset’s price.
The main difference between the two is that while the Alligator uses moving average lines, the Gator uses a histogram.
In this section, You will learn –
- What the Gator Indicator is and What it is used for.
- What the Gator Indicator is based on
- What the Gator Indicator is made up for
- What the four phases of the gator indicator are
- When to enter trades using the gator indicator
- What the best time frames are to use the gator indicators on
The Gator indicator is based on the principle that trends – just like a living alligator – go through four different phases:
- Sleeping (exhausted)
- Awakening (forming)
- Eating (strengthening)
- Sated (running out of momentum)
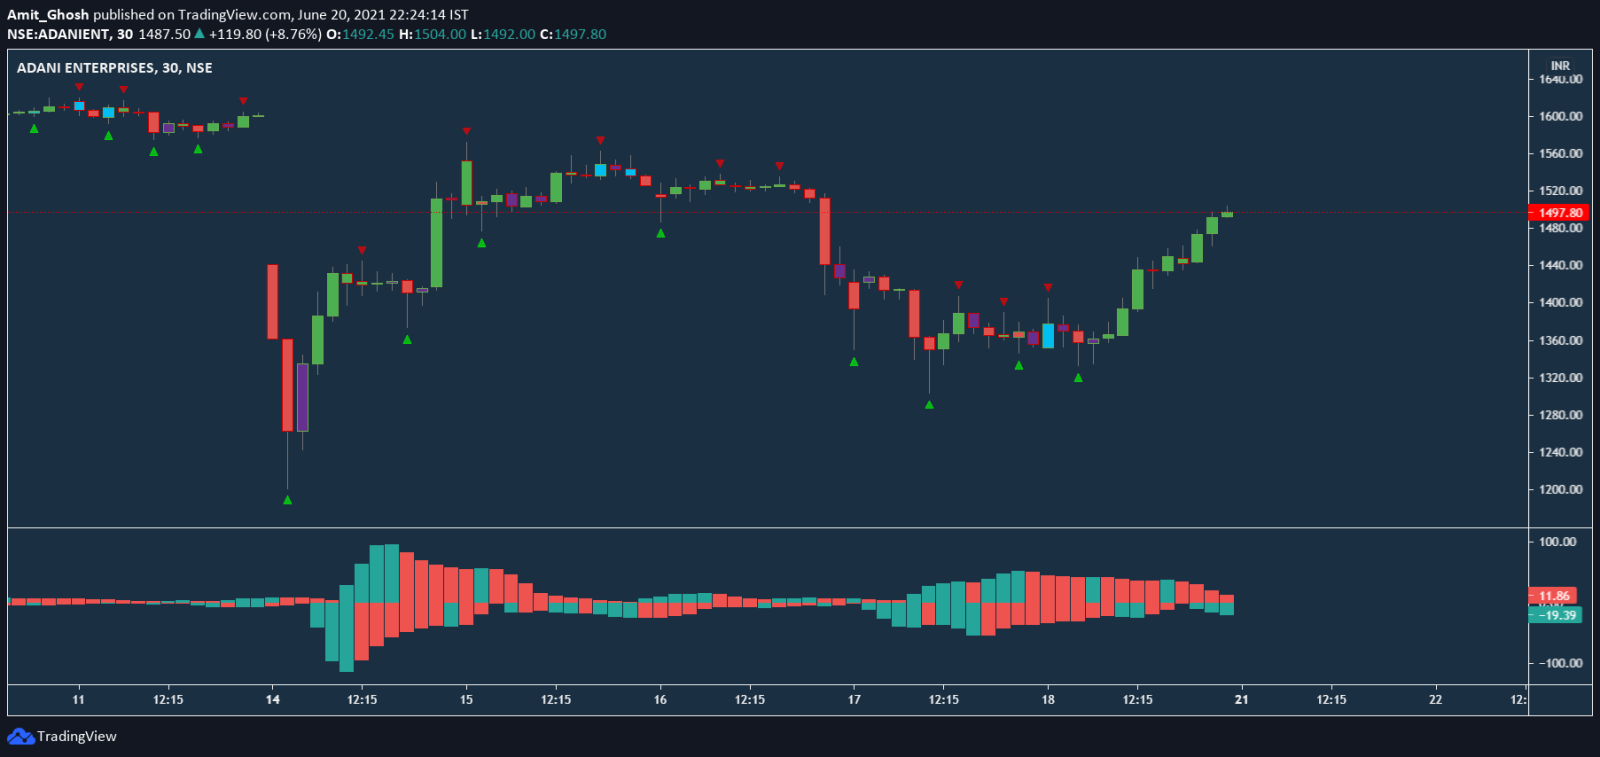
Each time period is represented by two bars, one on top of the other.
Sometimes they are both green, sometimes both red and sometimes they are both colours. So there are 4 combination – GG,RR,GR,RG
- A green bar indicates that a trend is stronger than the previous price action.
- A red bar indicates it is weaker than the previous price action.
The gator's four phases
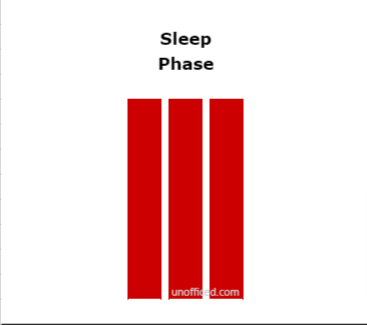
Sleep phase
During the Gator sleeps phase, both bars are red.
Awakening phase
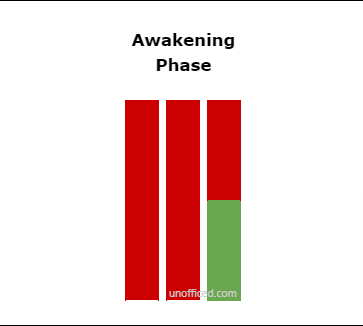
- The Gator awakens phase follows the Gator sleeps phase.
- It can be recognized when one of the red bars turns green.
- It does not matter whether the red or green bar is above or below the zero lines, as long as there is one of each.

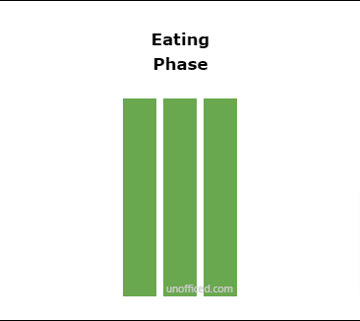
Eating phase
During the Gator eats phase, both bars turn green again.
Sated phase
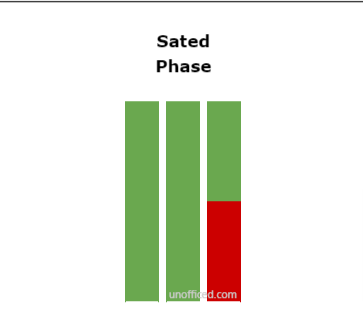
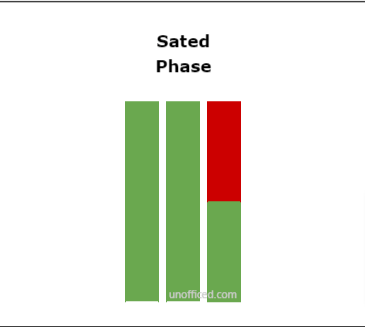
- The Gator’s sated phase follows the Gator eats phase.
- It occurs when one of the green bars turns red.
- Again, it does not matter whether the green or red bar is above or below zero, as long as there is one of each.
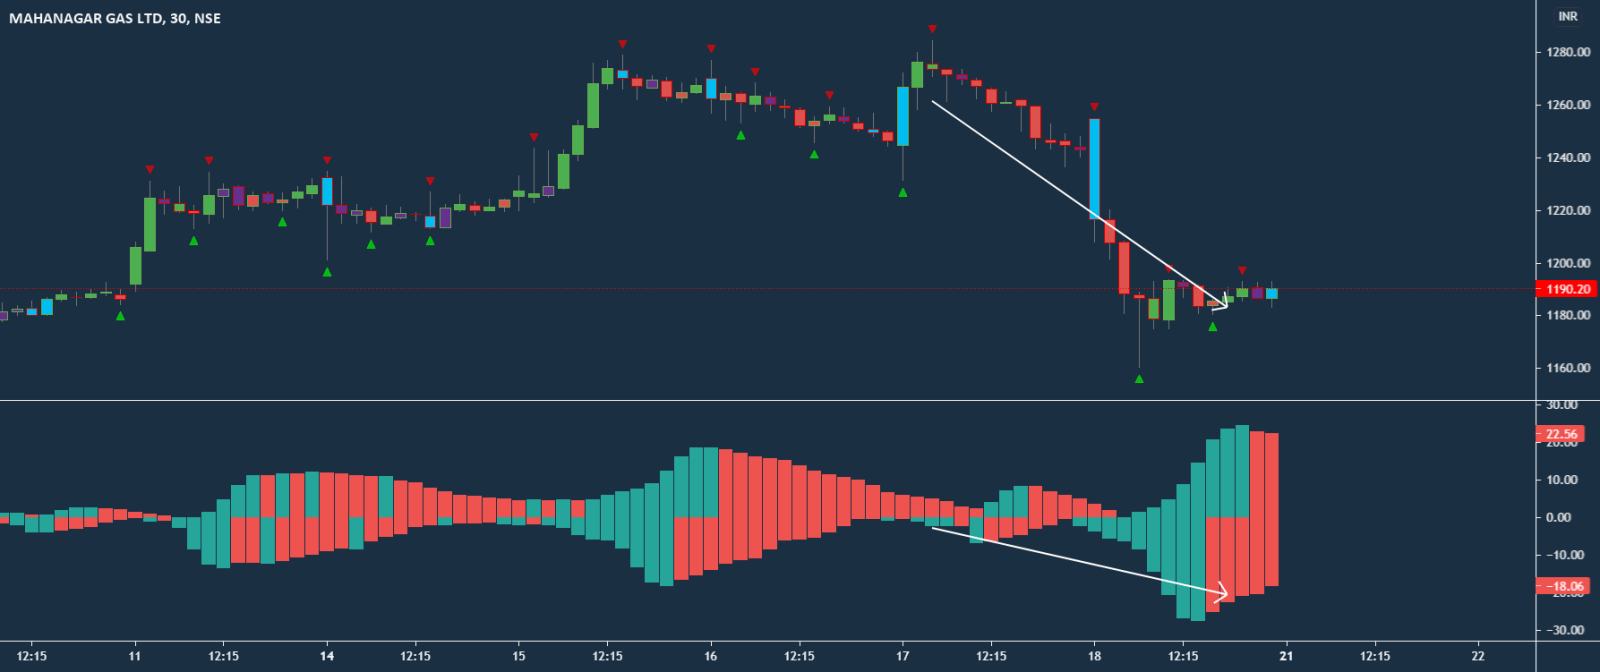
Enter trades as Gator awakens
When using the Gator oscillator,
- You will typically look to enter a position during its awakening phase,
- hold it through the eating phase,
- and then look to exit your position, and take profit during the sated phase as the trend nears completion.
As the Gator oscillator is based on a system of moving averages, be aware that there may be a time lag between price changes and the indicator moving into its various phases.
- Also, note that the Gator oscillator only tells you how strong or weak a trend is.
- It does not tell you in which direction prices are likely to move.
- It should, therefore, be combined with other indicators or a set of rules to determine which direction the trend is in.
The Gator oscillator works well in all market conditions as it is designed to identify each phase of the market’s cycles.
- It is best used however on medium to longer time frames. (15m, 1H, 4H)
- If it is used on lower time frames it may produce false signals.
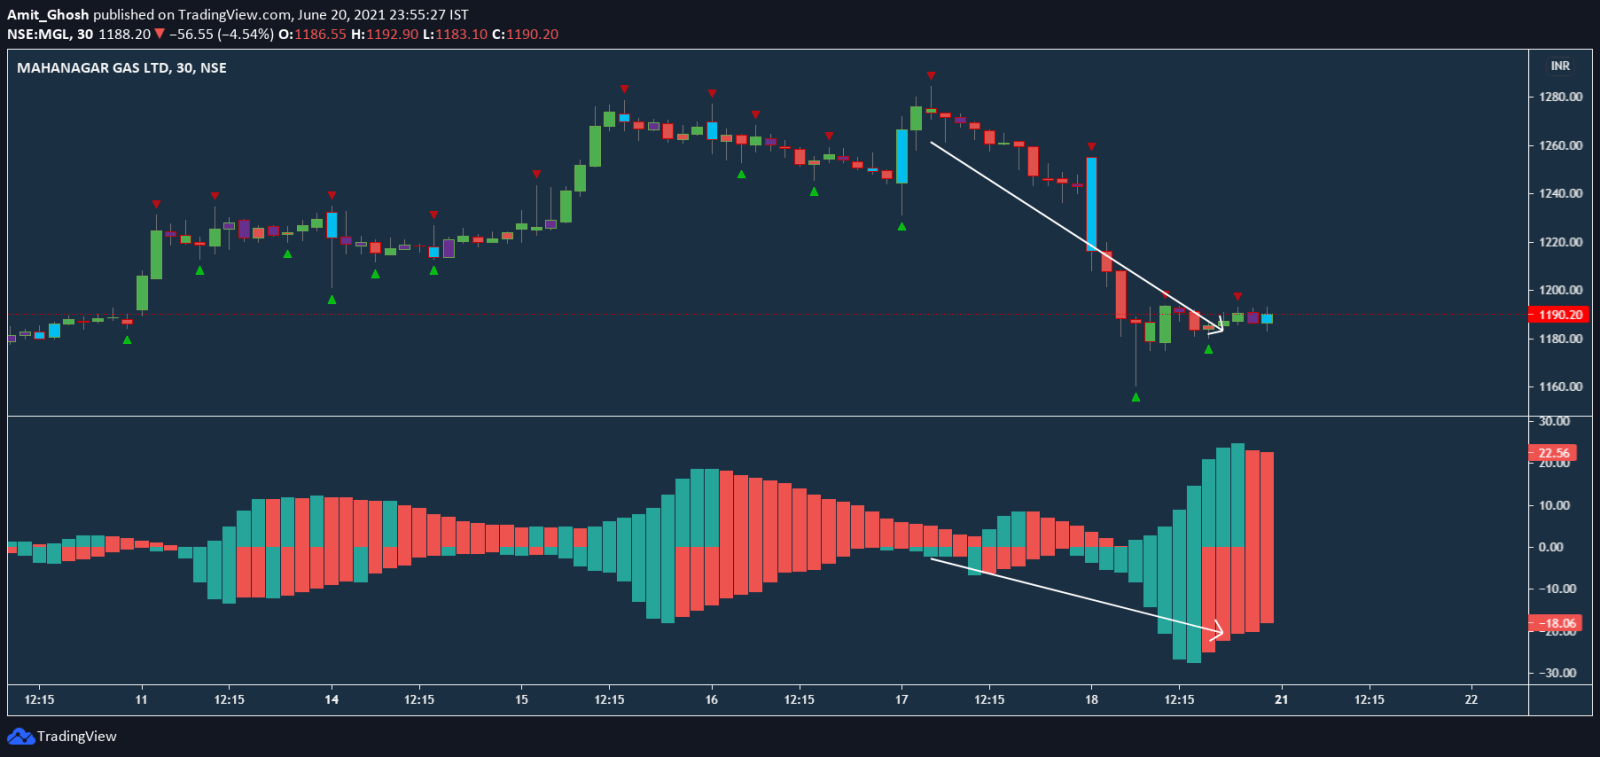
As it also triggers “Sell Signal” as per the theories of Price Signal. You can also see how the Alligator Oscillator indicator tells you to enter a position during the indicator’s awakening phase, hold it through the eating phase and exit it during the sated phase.
Note:
This indicator is a good alternative to MFI indicator We use in Entropy.
That’s it.
Hope You have enjoyed the discussion.

