Coding Heatmap Opening Range Breakout Strategy in Python – Part 1

The Opening Range Breakout Strategy
Opening Range Breakout (ORB) is a commonly used trading system by professional and amateur traders alike and has the potential to deliver high accuracy if done with optimal usage of indicators, strict rules and good assessment of overall market mood.
Prerequisite:
- Intraday Strategy: Opening Range Breakout [Read in Details]
- Coding an Algo Trading Bot: BankNIFTY Golden Ratio Strategy
In this tutorial, We shall be seeing How you can code “15 Mins Opening Range Breakout (ORB) Strategy using Python”. Also, We shall be applying this strategy to a selected range of stocks instead of all stocks. This variation of ORB Strategy is called –
Heatmap ORB Strategy
Strategy
Any stock creates a range in the first x minutes (Here, We are taking 15 minutes) of trading in a day. This is calling Opening Range. The highs and lows of this timeframe are taken as support and resistance.
At 9:31, Check Top 5 Gainer and Loser.
- Buy 5 stocks who are in top5 gainers if the range breaks with SL at day’s low
- Sell 5 stocks who are in top5 losers if the range breaks with SL at day’s high
Algorithm Schema Design
Now, We can approach this problem in an interesting way –
- At 9:31, We will scan for Top 5 Gainer and Loser.
- We mark the High and Low of the aforesaid stocks at that time.
- Make a Loop that will continuously fetch the LTP of the stocks. Now, We need to bifurcate –
- For Gainers: If the LTP of the stock breaks the high of the range, We buy with stop loss at the low of the range.
- For Losers: If the LTP of the stock breaks the low of the range, We sell with stop loss at the high of the range.
To keep things simpler, We shall be coding the entire ORB Trading Automation with the Buy Idea part of Gainer stocks in the first half and later will extend to the Loser stocks replicating the same code and modifying the variables as the core theory will be same.
Step 1 : At 9:31, Check Top 5 Gainer and Loser.
Let’s assume We’re using the broker module only to fire orders and taking the other data from NSE’s website directly.
In this case, with slight browsing around, We can see the “Top Gainers” and “Top Losers” can be seen distinctively in NSE India website.
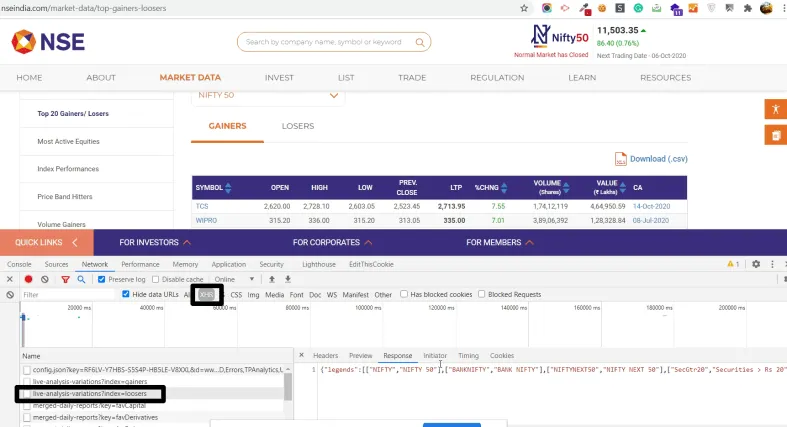
If we dig further with “Chrome Developer Tools” and their “Network Console”, and see the “XHR” requests, We found the URL https://www.nseindia.com/api/live-analysis-variations?index=gainers there. Let’s apply our nsefetch() function from NSEPython Module.
					from nsepython import *
gainers = nsefetch("https://www.nseindia.com/api/live-analysis-variations?index=gainers")
print(gainers)
It shows us the JSON Structure. Let’s copy that and put it to JSON Formatter for understanding the schema.
It is showing data from all the sectors. Lets check the Top 5 gainers and losers from NIFTY50 only.
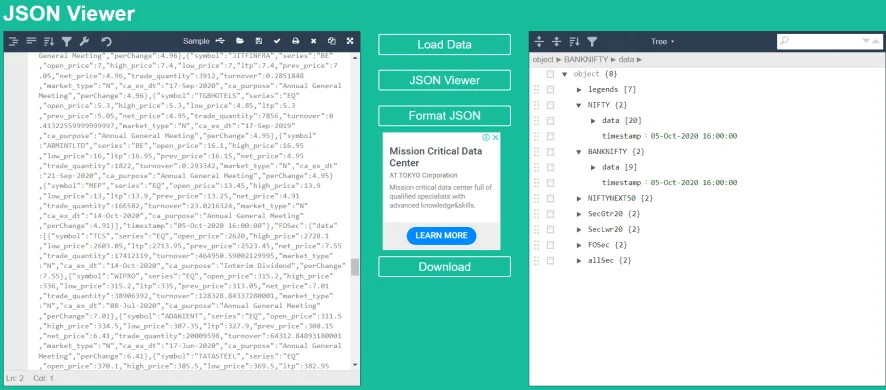
The next step will be pulling the data inside that list to a Pandas database.It is showing data from all the sectors. Lets check the Top 5 gainers and losers from NIFTY50 only.
					import pandas as pd

gainers=pd.DataFrame.from_records(gainers["NIFTY"]["data"])
print(gainers)
We have the pandas database sorted right now and with lots of extra information with it. The bigger question is what information you need and what you don’t.
To check that, let’s revisit our initial agenda !
					"symbol":"POWERGRID",
"series":"EQ",
"open_price":227.3,
"high_price":237.8,
"low_price":226.9,
"ltp":237.45,
"prev_price":226.15,
"net_price":5,
"trade_quantity":10158072,
"turnover":23655.102266399997,
"market_type":"N",
"ca_ex_dt":"08-Mar-2021",
"ca_purpose":"Interim Dividend - Rs 4 Per Share",
"perChange":5
Step 2 : Preparing Data for "Buy 5 stocks who are in top 5 gainers if the range breaks with SL at day's low" Part
So, from the above image of “Top gainers”,
- The “High Price” taken at 9:31 AM is hence considered as day high.
- We need to keep checking the current price i.e “LTP” with that value.
- If (“LTP” at any time> “Day High” of 9:31 AM): Buy with Stop Loss at “Day Low”.
Further Modifications –
- Also, Let’s first shorten the list to Top 5. (Let’s do the Top Part first.)
- Also, Remove the columns We do not need.
Now Let’s wrap it under a function –
					from nsepython import *

def get_gainers():
    gainers = nsefetch("<https://www.nseindia.com/api/live-analysis-variations?index=gainers>")
    gainers=pd.DataFrame.from_records(gainers["NIFTY"]["data"])
    gainers=gainers.head(5)
    gainers.drop(gainers.columns.difference(["symbol","high_price","low_price","ltp"]), 1, inplace=True)
    return gainers

gainers = get_gainers()
The output of this code will come like this. It serves our purpose beautifully.
					symbol high_price low_price
0 TCS 2728.1 2603.05
1 WIPRO 336.0 315.20
2 TATASTEEL 385.5 369.50
3 SUNPHARMA 525.1 503.80
4 JSWSTEEL 292.0 282.45
Although this function gives us the LTP along with it. We can also check LTP directly using the nse_quote_ltp() function.
nse_quote_ltp("TCS")
And, With slight help of for loop we can get all the LTP of symbols using the Pandas DataFrame.
					from nsepython import *

for i in range(0,5):
    print(nse_quote_ltp(gainers.symbol.iloc[i]))
But, Right now, We do not need the LTP in this case at this moment. Let’s make it more minimal by removing LTP.
					from nsepython import *

def get_gainers():
    gainers = nsefetch("https://www.nseindia.com/api/live-analysis-variations?index=gainers")
    gainers=pd.DataFrame.from_records(gainers["NIFTY"]["data"])
    gainers=gainers.head(5)
    gainers.drop(gainers.columns.difference(["symbol","high_price","low_price"]), 1, inplace=True)
    return gainers

gainers = get_gainers()
print(gainers)
Step 3 : Creating the PaperBot
Once that We have the list of gainers, Our job is to make the PaperBot that will continuously check for the LTP and trigger Buy if the LTP of the stock breaks the high of the range with stop loss at the low of the range.
And, with minor modifications, here goes the Paper Buy Trade Module –
					for i in range(0,5):
    symbol = gainers.symbol.iloc[i]
    current_ltp = nse_quote_ltp(symbol)

    day_high = gainers.high_price.iloc[i]
    day_low = gainers.low_price.iloc[i]

if(current_ltp>day_high): print(symbol+" triggered Buy at "+str(current_ltp)+" with a stop loss at "+ str(day_low))
This is checking very basic stuff which is already written as You can see. One can also fire Cover order from Broker API at the place of print() function.
To be Continued...
This is a part of the live discussion that happened on Unofficed Discussion Forum. Feel free to participate and engage in future discussions. Here are some agenda to be discussed later –
- Now, As We have seen in the Paperbot, the major flaw is – Once the symbol is triggered, We need to exclude the symbol from the list so that it doesn’t keep retriggering!
- Also, Although the cover order reduces the complexity immediately but, As we will also explore the normal orders, then We need to also keep checking for Stop Loss and Target Triggers.
- Apart from that, there shall be countless examples of error handling like How the code will handle in case there is a disconnection in the data provided by the broker?
Let’s discuss this further in the next part of this discussion. Don’t shy away to share your code snippets or variations in the forum if You trying something 🙂
By when we can expect the second part?
Instead fetching top gainer and losers from nse website we can get it from alice-blue API.
Saying bcoz nse website most of the time get updated.
At that time code may throw exception.
But, Our Church Aliceblue gives wrong data confidently.
[…] in our last article of Opening Rangehttps://unofficed.com/opening-range-breakout-python-part-i/ […]