
Tview Idea by Amit Ghosh: [Positional] Chola Swing Bet - Chola triggered a buy trade. But the stop loss is 200 points which is near 1150. So if you want to take, be sure of it.

Tview Idea by Amit Ghosh: [Positional] OIL Support and Resistance Trade -

Tview Idea by Amit Ghosh: [Positional] Petronet Price Action Analysis - We are recommending a buy based on the following technical analysis:
Analysis:
Trendline Breakout Potential:
The chart shows a well-defined downward sloping trendline that has acted as a resistance since mid-August 2024.
The price is currently approaching this trendline, suggesting a possible breakout. A confirmed breakout above this trendline could signal a reversal of the existing downtrend.
Higher Lows Formation:
Recent price action indicates the formation of higher lows, a bullish sign that suggests increasing buying pressure and potential momentum to break the trendline.
Price Action Support:
The current candle shows bullish momentum, closing higher at ₹337.30 (+1.26%). This reinforces the possibility of further upward movement.
Volume Not Considered Here:
While this analysis doesn't include volume data, a breakout accompanied by strong volume would further validate the bullish setup.
Key Technical Levels:
Resistance: ₹344-₹350 (near the trendline). A breakout above this level is crucial for sustained upside.
Support: ₹320-₹325 (recent higher low zone), acting as a strong base.
Recommendation:
Entry Point: Consider entering above ₹344 to confirm the breakout.
Target Levels: ₹360 (short-term), ₹375 (medium-term).
Stop Loss: Place a stop loss below ₹325 to manage risk effectively.
Caution: Always combine technical analysis with fundamental insights and market conditions. Ensure the breakout sustains before committing to a position. Consider consulting additional sources for a holistic view.
Analysis:
Trendline Breakout Potential:
The chart shows a well-defined downward sloping trendline that has acted as a resistance since mid-August 2024.
The price is currently approaching this trendline, suggesting a possible breakout. A confirmed breakout above this trendline could signal a reversal of the existing downtrend.
Higher Lows Formation:
Recent price action indicates the formation of higher lows, a bullish sign that suggests increasing buying pressure and potential momentum to break the trendline.
Price Action Support:
The current candle shows bullish momentum, closing higher at ₹337.30 (+1.26%). This reinforces the possibility of further upward movement.
Volume Not Considered Here:
While this analysis doesn't include volume data, a breakout accompanied by strong volume would further validate the bullish setup.
Key Technical Levels:
Resistance: ₹344-₹350 (near the trendline). A breakout above this level is crucial for sustained upside.
Support: ₹320-₹325 (recent higher low zone), acting as a strong base.
Recommendation:
Entry Point: Consider entering above ₹344 to confirm the breakout.
Target Levels: ₹360 (short-term), ₹375 (medium-term).
Stop Loss: Place a stop loss below ₹325 to manage risk effectively.
Caution: Always combine technical analysis with fundamental insights and market conditions. Ensure the breakout sustains before committing to a position. Consider consulting additional sources for a holistic view.

Tview Idea by Amit Ghosh: [Positional] Crude Buy Bet - SL at day's low. High chance of triggering.
Note -
One of the best forms of Price Action is to not try to predict at all. Instead of that, ACT on the price. So, this chart tells at "where" to act in "what direction. Unless it triggers, like, let's say the candle doesn't break the level which says "Buy if it breaks", You should not buy at all.
=======
I use shorthands for my trades.
"Positional" - means You can carry these positions and I do not see sharp volatility ahead. (I tally upcoming events and many small kinds of stuff to my own tiny capacity.)
"Intraday" -means You must close this position at any cost by the end of the day.
"Theta" , "Bounce" , "3BB" or "Entropy" - My own systems.
=======
I won't personally follow any rules. If I "think" (It is never gut feel. It is always some reason.) the trade is wrong, I may take reverse trade. I may carry forward an intraday position. What is meant here - You shouldn't follow me because I may miss updating. You should follow the system I share.
=======
Like -
Always follow a stop loss.
In the case of Intraday trades, it is mostly the "Day's High".
In the case of Positional trades, it is mostly the previous swings.
I do not use Stop Loss most of the time. But I manage my risk with options as I do most of the trades using derivatives
Note -
One of the best forms of Price Action is to not try to predict at all. Instead of that, ACT on the price. So, this chart tells at "where" to act in "what direction. Unless it triggers, like, let's say the candle doesn't break the level which says "Buy if it breaks", You should not buy at all.
=======
I use shorthands for my trades.
"Positional" - means You can carry these positions and I do not see sharp volatility ahead. (I tally upcoming events and many small kinds of stuff to my own tiny capacity.)
"Intraday" -means You must close this position at any cost by the end of the day.
"Theta" , "Bounce" , "3BB" or "Entropy" - My own systems.
=======
I won't personally follow any rules. If I "think" (It is never gut feel. It is always some reason.) the trade is wrong, I may take reverse trade. I may carry forward an intraday position. What is meant here - You shouldn't follow me because I may miss updating. You should follow the system I share.
=======
Like -
Always follow a stop loss.
In the case of Intraday trades, it is mostly the "Day's High".
In the case of Positional trades, it is mostly the previous swings.
I do not use Stop Loss most of the time. But I manage my risk with options as I do most of the trades using derivatives

Tview Idea by Amit Ghosh: [Positional] Chola Swing Bet - Chola triggered a buy trade. But the stop loss is 200 points which is near 1150. So if you want to take, be sure of it.
Tview Idea by Amit Ghosh: [Positional] OIL Support and Resistance Trade -
Tview Idea by Amit Ghosh: [Positional] Petronet Price Action Analysis - We are recommending a buy based on the following technical analysis:
Analysis:
Trendline Breakout Potential:
The chart shows a well-defined downward sloping trendline that has acted as a resistance since mid-August 2024.
The price is currently approaching this trendline, suggesting a possible breakout. A confirmed breakout above this trendline could signal a reversal of the existing downtrend.
Higher Lows Formation:
Recent price action indicates the formation of higher lows, a bullish sign that suggests increasing buying pressure and potential momentum to break the trendline.
Price Action Support:
The current candle shows bullish momentum, closing higher at ₹337.30 (+1.26%). This reinforces the possibility of further upward movement.
Volume Not Considered Here:
While this analysis doesn't include volume data, a breakout accompanied by strong volume would further validate the bullish setup.
Key Technical Levels:
Resistance: ₹344-₹350 (near the trendline). A breakout above this level is crucial for sustained upside.
Support: ₹320-₹325 (recent higher low zone), acting as a strong base.
Recommendation:
Entry Point: Consider entering above ₹344 to confirm the breakout.
Target Levels: ₹360 (short-term), ₹375 (medium-term).
Stop Loss: Place a stop loss below ₹325 to manage risk effectively.
Caution: Always combine technical analysis with fundamental insights and market conditions. Ensure the breakout sustains before committing to a position. Consider consulting additional sources for a holistic view.
Analysis:
Trendline Breakout Potential:
The chart shows a well-defined downward sloping trendline that has acted as a resistance since mid-August 2024.
The price is currently approaching this trendline, suggesting a possible breakout. A confirmed breakout above this trendline could signal a reversal of the existing downtrend.
Higher Lows Formation:
Recent price action indicates the formation of higher lows, a bullish sign that suggests increasing buying pressure and potential momentum to break the trendline.
Price Action Support:
The current candle shows bullish momentum, closing higher at ₹337.30 (+1.26%). This reinforces the possibility of further upward movement.
Volume Not Considered Here:
While this analysis doesn't include volume data, a breakout accompanied by strong volume would further validate the bullish setup.
Key Technical Levels:
Resistance: ₹344-₹350 (near the trendline). A breakout above this level is crucial for sustained upside.
Support: ₹320-₹325 (recent higher low zone), acting as a strong base.
Recommendation:
Entry Point: Consider entering above ₹344 to confirm the breakout.
Target Levels: ₹360 (short-term), ₹375 (medium-term).
Stop Loss: Place a stop loss below ₹325 to manage risk effectively.
Caution: Always combine technical analysis with fundamental insights and market conditions. Ensure the breakout sustains before committing to a position. Consider consulting additional sources for a holistic view.
Tview Idea by Amit Ghosh: [Positional] Crude Buy Bet - SL at day's low. High chance of triggering.
Note -
One of the best forms of Price Action is to not try to predict at all. Instead of that, ACT on the price. So, this chart tells at "where" to act in "what direction. Unless it triggers, like, let's say the candle doesn't break the level which says "Buy if it breaks", You should not buy at all.
=======
I use shorthands for my trades.
"Positional" - means You can carry these positions and I do not see sharp volatility ahead. (I tally upcoming events and many small kinds of stuff to my own tiny capacity.)
"Intraday" -means You must close this position at any cost by the end of the day.
"Theta" , "Bounce" , "3BB" or "Entropy" - My own systems.
=======
I won't personally follow any rules. If I "think" (It is never gut feel. It is always some reason.) the trade is wrong, I may take reverse trade. I may carry forward an intraday position. What is meant here - You shouldn't follow me because I may miss updating. You should follow the system I share.
=======
Like -
Always follow a stop loss.
In the case of Intraday trades, it is mostly the "Day's High".
In the case of Positional trades, it is mostly the previous swings.
I do not use Stop Loss most of the time. But I manage my risk with options as I do most of the trades using derivatives
Note -
One of the best forms of Price Action is to not try to predict at all. Instead of that, ACT on the price. So, this chart tells at "where" to act in "what direction. Unless it triggers, like, let's say the candle doesn't break the level which says "Buy if it breaks", You should not buy at all.
=======
I use shorthands for my trades.
"Positional" - means You can carry these positions and I do not see sharp volatility ahead. (I tally upcoming events and many small kinds of stuff to my own tiny capacity.)
"Intraday" -means You must close this position at any cost by the end of the day.
"Theta" , "Bounce" , "3BB" or "Entropy" - My own systems.
=======
I won't personally follow any rules. If I "think" (It is never gut feel. It is always some reason.) the trade is wrong, I may take reverse trade. I may carry forward an intraday position. What is meant here - You shouldn't follow me because I may miss updating. You should follow the system I share.
=======
Like -
Always follow a stop loss.
In the case of Intraday trades, it is mostly the "Day's High".
In the case of Positional trades, it is mostly the previous swings.
I do not use Stop Loss most of the time. But I manage my risk with options as I do most of the trades using derivatives

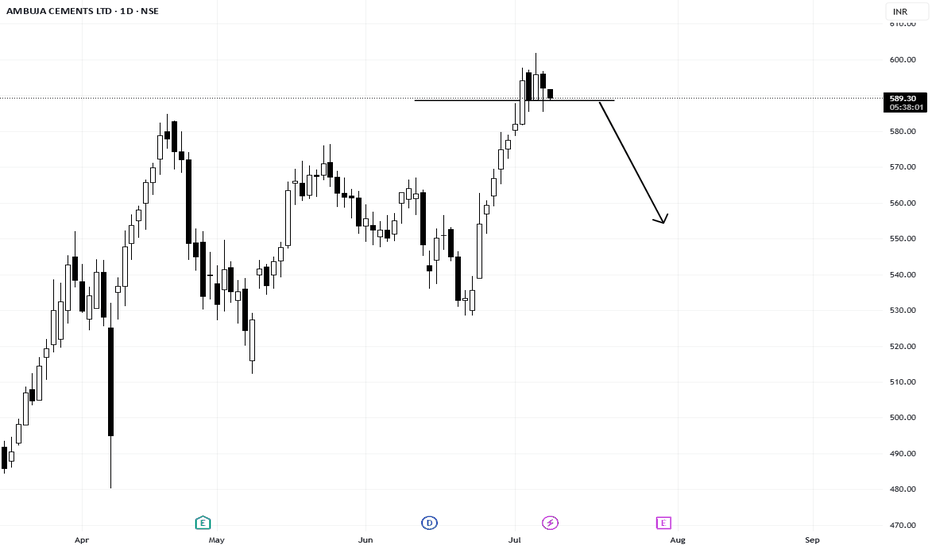
Tview Idea by Amit Ghosh: [Positional] Ambuja Cements Short Idea -
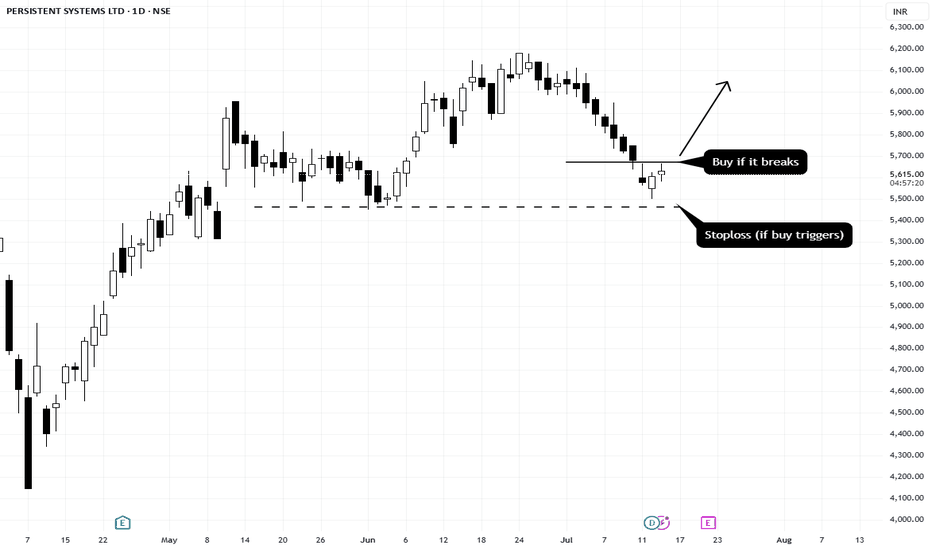
Tview Idea by Amit Ghosh: [Positional] Balkrishna Weekend Strategy -
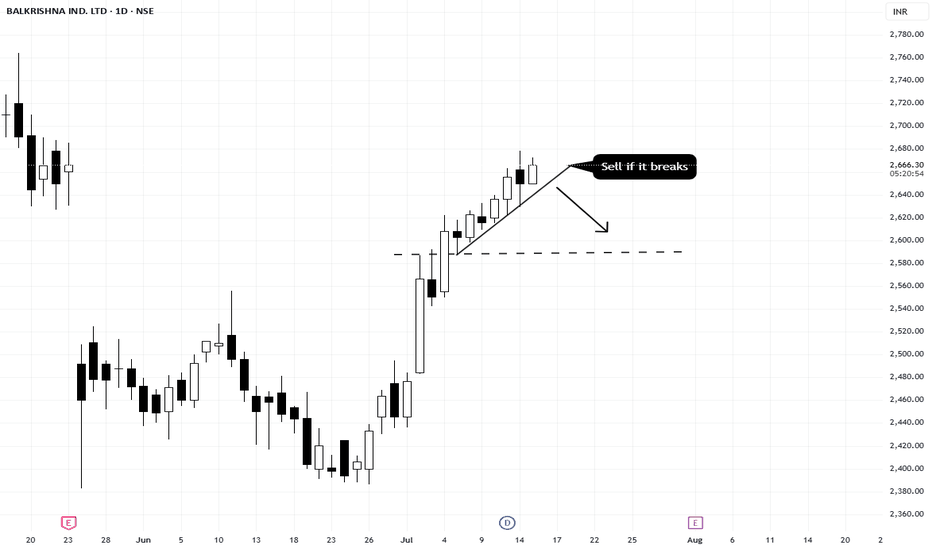
Tview Idea by Amit Ghosh: [Positional] Crude Buy Bet - SL at day's low. High chance of triggering.
Note -
One of the best forms of Price Action is to not try to predict at all. Instead of that, ACT on the price. So, this chart tells at "where" to act in "what direction. Unless it triggers, like, let's say the candle doesn't break the level which says "Buy if it breaks", You should not buy at all.
=======
I use shorthands for my trades.
"Positional" - means You can carry these positions and I do not see sharp volatility ahead. (I tally upcoming events and many small kinds of stuff to my own tiny capacity.)
"Intraday" -means You must close this position at any cost by the end of the day.
"Theta" , "Bounce" , "3BB" or "Entropy" - My own systems.
=======
I won't personally follow any rules. If I "think" (It is never gut feel. It is always some reason.) the trade is wrong, I may take reverse trade. I may carry forward an intraday position. What is meant here - You shouldn't follow me because I may miss updating. You should follow the system I share.
=======
Like -
Always follow a stop loss.
In the case of Intraday trades, it is mostly the "Day's High".
In the case of Positional trades, it is mostly the previous swings.
I do not use Stop Loss most of the time. But I manage my risk with options as I do most of the trades using derivatives
Note -
One of the best forms of Price Action is to not try to predict at all. Instead of that, ACT on the price. So, this chart tells at "where" to act in "what direction. Unless it triggers, like, let's say the candle doesn't break the level which says "Buy if it breaks", You should not buy at all.
=======
I use shorthands for my trades.
"Positional" - means You can carry these positions and I do not see sharp volatility ahead. (I tally upcoming events and many small kinds of stuff to my own tiny capacity.)
"Intraday" -means You must close this position at any cost by the end of the day.
"Theta" , "Bounce" , "3BB" or "Entropy" - My own systems.
=======
I won't personally follow any rules. If I "think" (It is never gut feel. It is always some reason.) the trade is wrong, I may take reverse trade. I may carry forward an intraday position. What is meant here - You shouldn't follow me because I may miss updating. You should follow the system I share.
=======
Like -
Always follow a stop loss.
In the case of Intraday trades, it is mostly the "Day's High".
In the case of Positional trades, it is mostly the previous swings.
I do not use Stop Loss most of the time. But I manage my risk with options as I do most of the trades using derivatives


