Technical analysis of stocks and price action
I’d like to start with what is Price Action and how it is a part of Technical Analysis. Technical Analysis is used to evaluate any security (stock, currency, commodity) to forecast its future move. It heavily relies on price, volume, patterns, indicators, waves etc. However technical analysis has few redundant concepts which strip off to come to a simplified product (set of concepts) called as Price Action.
In Price Action, we rely only on upon and only on price (not even giving enough importance to volume). Hence Price Action is a subset of Technical Analysis. We will follow naked price charts without any lagging indicators to identify high probability winning setups. To filter whipsaws we will follow some basic rules for directional trades (All these concepts apply to directional trades i.e. where there is no hedging involved)
When to use Price Action?
Price Action concepts should be used in a security where there is liquidity. Where the volume of freely floating shares is reasonably high so that a single party can’t manipulate the movement of price. Here we directly cross out some of the penny scripts ( the ones trading in few rupees with extremely low volume ), Future and options contracts of the further months where the buyer and seller gap is huge. Preferably go for scripts which are NSE Listed and actively traded in FNO segment.
Scripts like Tata Motors, Tata Steel, Axis Bank, SBI, Canara Bank etc are the ones with good liquidity where Price Action concepts should be used. This is because the concept of Demand and Supply will only rule the price rather than manipulation. This basic rule will help us from being stuck in Penny scripts like Goldstone Infra, Usha Martin Education Solutions, Kushal Tradelink and the infamous Dr.Datson ( Got unlisted after a series of Lower Circuits in 2015 ). We will stick to good quality, highly liquid scripts for practicing these concepts.
When not to use Price Action?
Apart from the above-mentioned penny, illiquid scripts, there are times when we shouldn’t be using Price Action (Even in good, liquid scripts). When there are company results, one should strictly avoid going in for directional trades. Either you hedge your trade or perish. Nobody can definitely say where the price will go after a certain set of results. After poor numbers, Bharti Airtel shot up by 8%. Those who shorted on the basis of this news might have wiped off their portfolios.
I will show examples with charts once I cover these basic hygiene rules. The reason we stay away from news and those who claim to have insider insights is that of this old and path-breaking theory which set the tone for Technical Analysis all over the world. That is the Dow Theory.
Dow theory has a concept which says ” Market discounts everything/future “.It means what ever is happening on the price charts will tell you a story about what will happen in the near future.
It is in a decoded format and we have to train our eyes in such a way that the charts start talking to us. These concepts are such that we don’t have to dig in deeper and deeper in the charts. In few seconds, the charts will speak to you. This, of course, comes with practice, but the point to be noted is that anyone and everyone can achieve this feat. Price action is to be used by itself. It can be combined with other forms of analysis of thought.
Now that we have covered the basic do’s and don’ts, I shall start with the most basic concept which forms the backbone of price action trading. That is Trend Analysis.
The definition of ‘Trend’ in the Oxford Dictionary is ‘ A general direction in which something is developing or changing “. The key word is DIRECTION. If you identify the direction of the stock, currency or commodity (security), you have won, half the battle.
Going against the direction is the major reason why traders lose money irrespective of following all other concepts/news. In easier words, if you swim down a waterfall and you reach the bottom, you are no Micheal Phelps to have achieved this feat. You are just going with the flow. You are following the trend and the trend is just taking you places. At the same time, even if you are somewhere close to Micheal Phelps, you will not be able to swim up a waterfall.
You may be able to do it once or twice if your luck permits but this is not a sustainable activity to pursue. Hence, remember the old age -Trend is your Friend
Moving towards examples with the help of charts.
Q. How to filter stocks?
A. We will look into Nifty 50 scripts which are actively traded ( preferably the ones in FNO ) 2. By using trend analysis. So by the end of the session, it will be clear to you.
Q. You find the direction after the major news happens? That means you will also miss the major moves. Also, this strategy works in both markets? I mean trending and sideways?
A. I find the directions regardless of the moves. Only at times of strong news like results, I avoid a trade as it is prone to high intraday volatility. The positional view remains the same (unless it is a news which states the company is shutting down) Yes it works on trending as well as sideways. There are the different set of rules for both.
Q. On what time frame is this most beneficial
A. These concepts work on all time frames but my favorite is the Daily Time frame.
Q. But the market is range bound 80% of the time…
A. That stat may not be true as nifty is heavily trending for the last 3 years (either up or down, but spent very less time moving sideways). Also, trend depends on the frame of reference we choose. I shall explain this concept in a while.
I shall share 2 charts to give you a layman’s understanding of what is a trend.
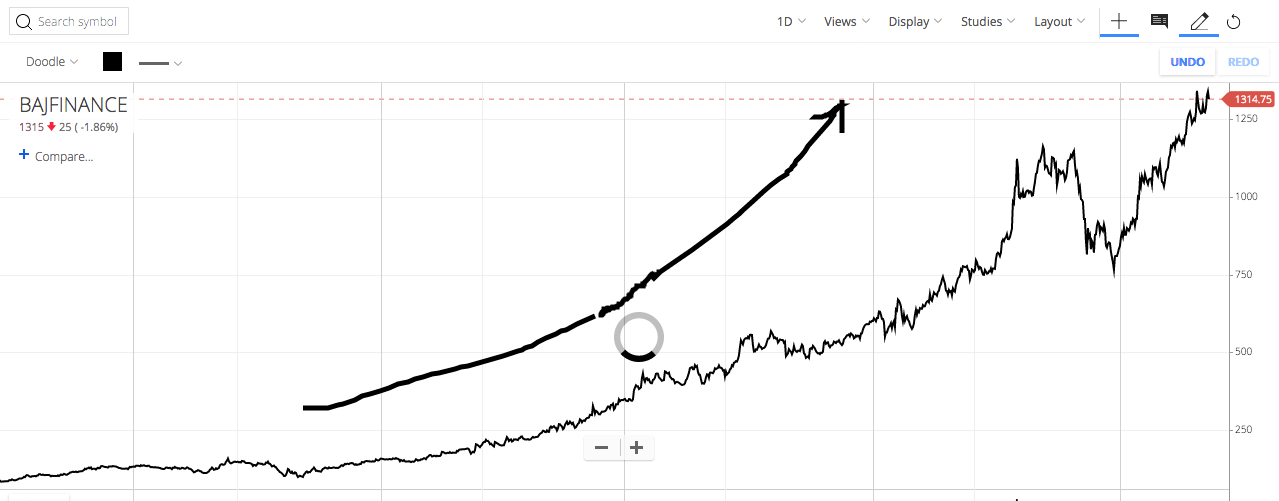
This is an up trend.
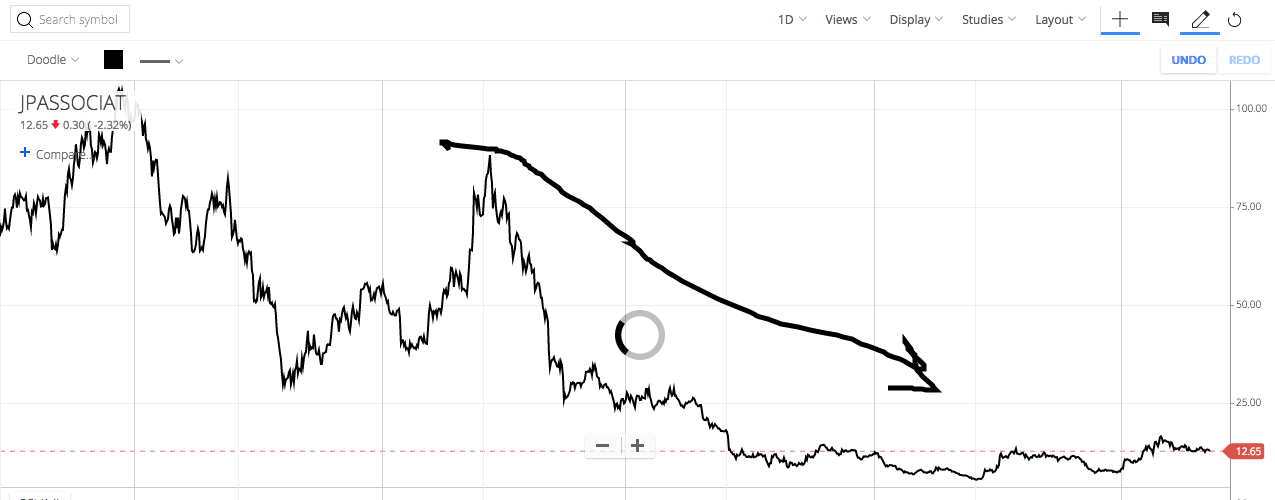
This is a down trend
The first chart is of Bajaj Finance. I’ve taken a line chart to look at the trend. Show this chart to any Tom Dick Harry and he will tell you that ” It looks like the price is moving up “. The second Chart is of JP Associates. The same TDH will say ” Looks like a terrible stock, the price is going down ”
The layman’s understanding of what is going up and what is going down needs to be refined slightly to become a master of trend analysis. I am emphasizing again that the backbone of this course is something very easy to comprehend but usually ignored by traders.
We need to keep certain steps in mind to analyze the trend of any security within minutes (for freshers) and within seconds (for the hardworking traders who will do their homework )
First and foremost, remember that the chart is a result of millions of traders buying and selling their stocks every minute. Hence there is Demand and Supply at any given point in time. When there is demand, the price goes up and when there is supply, the price goes down. Hence the price of a stock can not move up in a straight line.
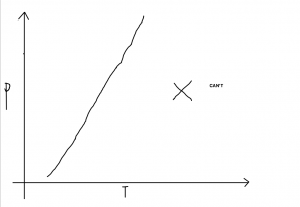
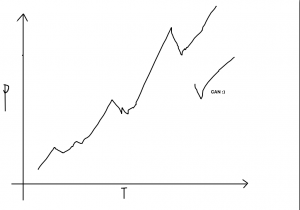
Just like your life, there will be ups and downs but overall, we can see that price has gone up
Q. How to find that trend has started, looking chart after a trade is easy for a kid too
A. These concepts are pretty easy. Trust me a school kid can also ace them with a decent amount of practice.
We need to come with a set of rules which can help us make an unbiased decision whether it is an uptrend or not. This is where we will have an edge over others. We won’t be one of those traders who say ” Aisa ho sakta hai, waisa bhi ho sakta hai / This may or may not happen “. We will take decisions strictly on those rules
To start with the rules, remember that with respect to trend analysis, there are 4 positions ” Higher Top, Higher Bottom, Lower Top, Lower Bottom “. Whether we find higher / lower tops or bottoms is the key to analysis and deciding the trend of the trade.
Definition of an uptrend: When we spot two consecutive tops ( with the second one being a higher top ) and two consecutive bottoms ( with the second one being a higher bottom ) we conclude that the uptrend has started. Before this goes as a bouncer, I shall explain with diagrams.
Q. Are gaps also counted? I mean during the higher top, higher bottom
A. Yes
Q. Isn’t a trend relative to the chosen timeframe?
A. Yes
Now I’m posting 4 diagrams and after that, I shall explain them.
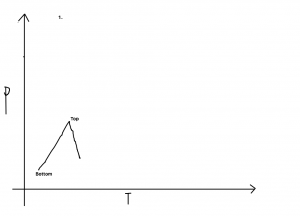
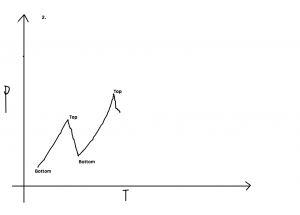
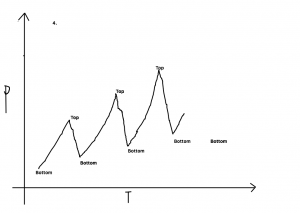
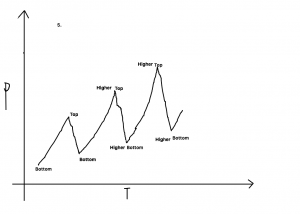
Basic identification marks: Any peak will be considered as a Top and any trough/Valley will be considered as a bottom. As the price is going up, it is making a series of peaks and valleys. However, the most important observation is that the tops and bottoms are slightly higher than the previous ones. Hence we come up with the terms Higher top Higher Bottom

Q. All this while no consideration to volume?
A. No consideration is given to volume at this stage.
Q. Which TF to use?
A. It works on all-time frames. I use daily
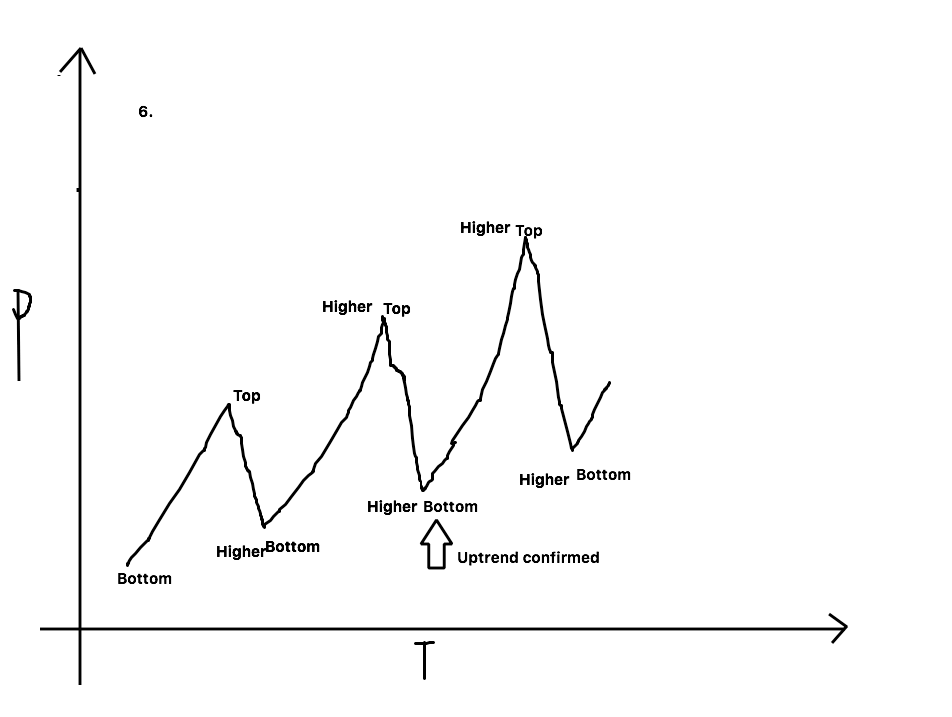
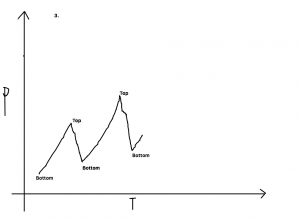
As per the rule, after we have to two tops and bottoms ( the second one higher than the previous one ), we confirm that the trend is up. Not even GOD can tell till when the trend will be up. But until the time it is up making hay while the sun shines. By definition, the trend is up till it is making consecutive higher tops and higher bottoms. There will once be a moment where it doesn’t make a higher top / higher bottom. Price goes down and starts making a lower bottom instead of the higher bottom and lower top instead of a higher top. This is where you have to be cautious. I shall illustrate the stage of caution followed
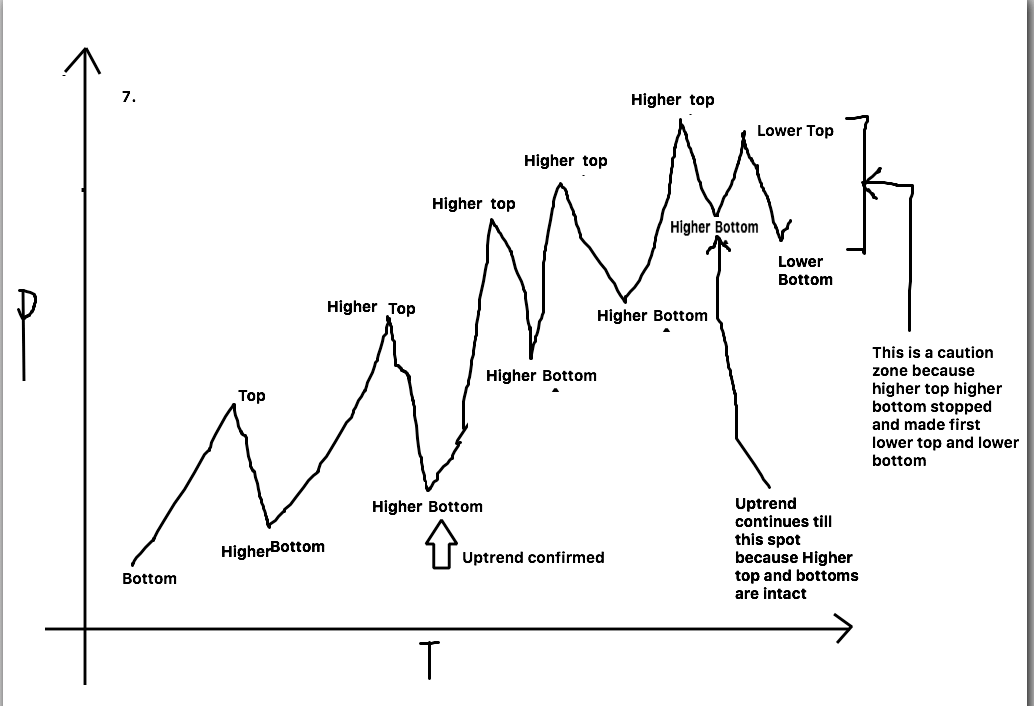
by the stage where we can confirm that the trend is changed and reversed to down. Now the trend is continued till higher tops and higher bottoms are intact. We will be in buy direction and not use our intelligence till the trend continues. Jab Tak Mazza le Sakte hai Le Lo. Our intelligence comes into the picture when we see a discrepancy in the trend. Look at how the higher top and higher bottom ceased to exist. It formed the first lower top and lower bottom. This is a state of caution and we will hold onto our positions over here. No way we will add new positions.
Now I’ll take an example and show how to confirm that the trend is down.
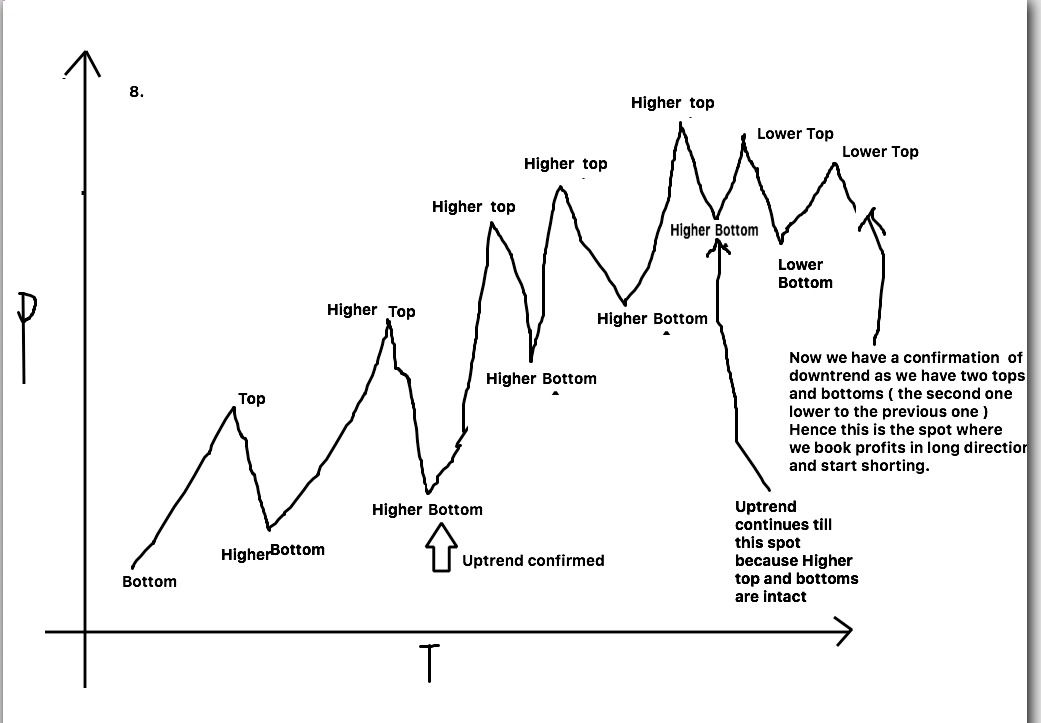
The rule is: Till the trend is confirmed up, it will go up, the moment we get a confirmation of downtrend, we book our profits and reverse our positions. This is similar to the first law of motion ”
An object at rest stays at rest and an object in motion stays in motion with the same speed and in the same direction unless acted upon by an unbalanced force.
” Till an external strong supply doesn’t change the trend to down, the uptrend will continue”.
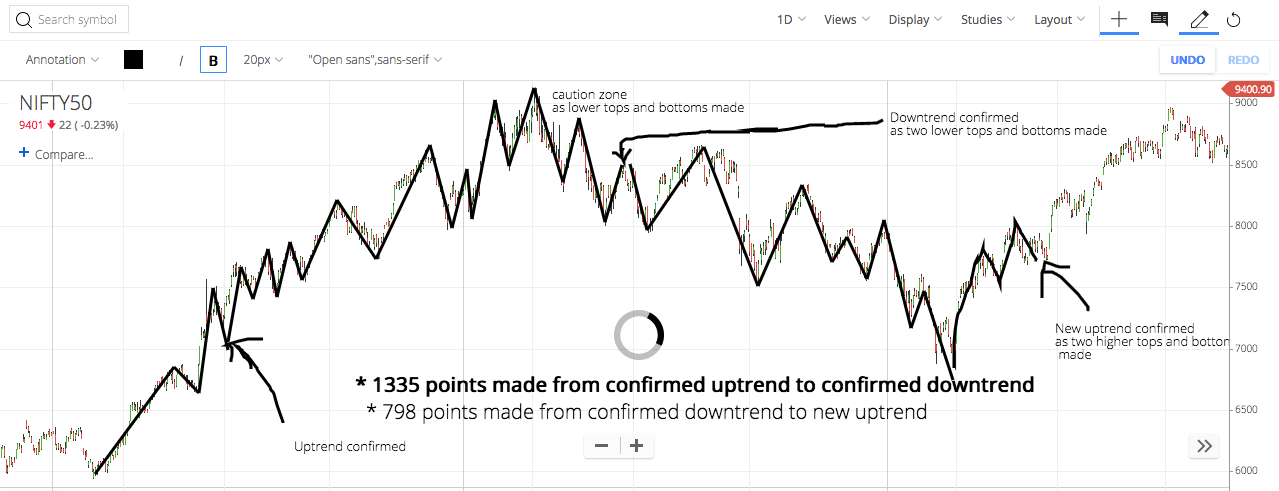
Finally, I will post a chart of nifty showing points where uptrend was confirmed and where downtrend was confirmed. How many points made in the long direction and how many points made in down direction. The homework will be practice uptrend on 4 charts, similarly practice downtrend by reversing all rules.