Volume Profile Trading with India Cement Futures

Volume profile Trading is a tough art. So Today I will give you one example of how to trade using Volume Profile –
First, we get the volume profile zone by looking at volume profile in higher Time Frame like Daily/Hourly.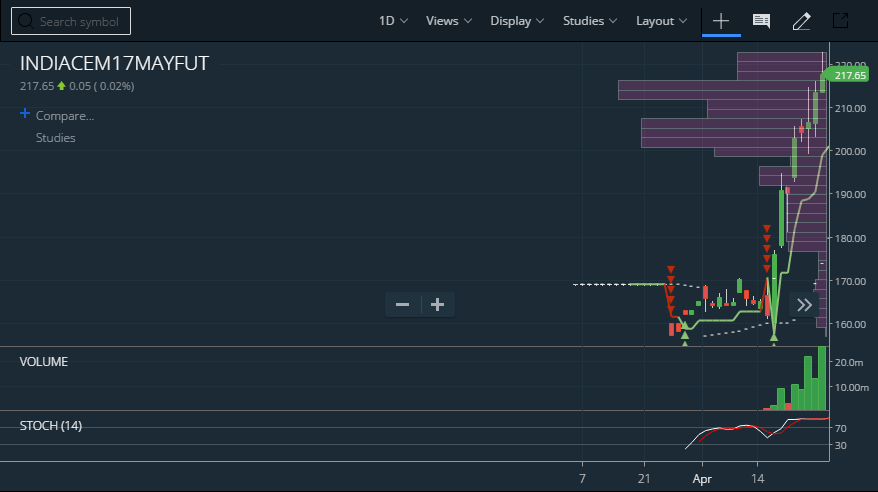
This is India Cement May Future’s Daily chart.
Now we look for long volume buildup on the right side i.e. Volume Profile and we identify the zone where the longest candles on volume profile lie. And also look at the associated volume candles in that price zone.
So as we see Volume Profile is highest at the 213-216 level and the volume (By Volume it’s meant, Volume Histogram) in that level is also high, then we can infer that a lot of people have entered into that zone in a short period of time.
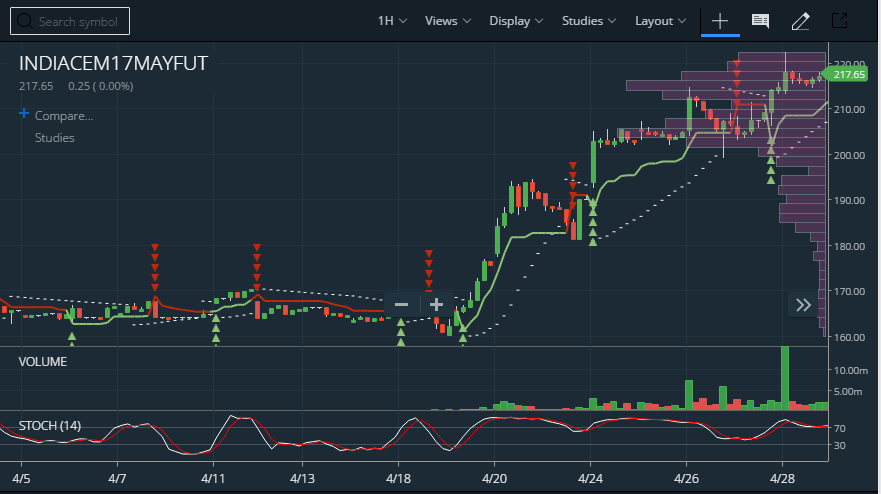
This is India Cement May Future’s Hourly chart.
But what if the volume histogram shows low volume?
[sociallocker]In that case, the strength of our trading opportunity will be low. but as volume profile is depicting the highest candle there so it will act as a support zone, but how long, it’s unanswered!
That’s why we use daily charts mostly as it’s more authentic and simple to understand because you don’t have to worry about the minor changes in volume there.
[/sociallocker]What we can infer from the hourly chart is there are 2 support zones here – 210 and 213. So if it is coming down from 216 then it will break in the step by step. If it breaks 213 then target 210 and so on.
So here is what we shall act based on the daily time frame –
We see Volume Profile is highest at the 213-216 level right? Now this zone will act as a stop and reverse in smaller Time frames as well.
So if the zone was formed under an uptrend and you see green volume candles supporting the same zone, then it will be a support zone, so when the price reaches this zone then we can see buying again, and if it breaches the zone then the price will drop sharply as the traders will try to close their position and will send the price further down and hence creating a resistance.
So, this is a story of the reaction of support and resistance. We’re knowing it beforehand where it is going to create.
Currently, the market is trading above it.
So if it retracts then it should find support in 213-216 zone as this is where people entered the market. And if this zone is broken by price action then the price will drop fast and more SL will be hit, sending the market further down.
Q. On 4/28, large volume was traded and 215 level was broken. So isn’t it a breakout signal?
A. When you use the term signal, you mean you see a confirmed trading opportunity but just one indicator can not confirm you a trading opportunity.
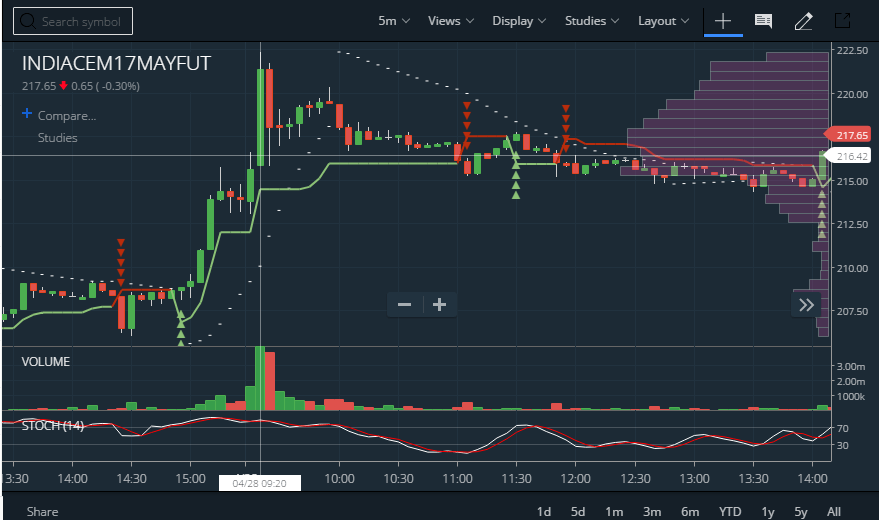
Please also do check the 5 minutes chart on that very day after that along with the volume indicators. In the above picture, this is the big green candle which we’re talking about. We can see it can actually go shorted on that very day based as it is consolidating.
We always see higher timeframes to spot an opportunity but lower timeframes are needed to spot an entry in that opportunity. The stock is anyways trading at its 52 weeks high; so We see a consolidation after the breakout. now it can go further up, but will it sustain the higher level or not, only time will tell. Volume Profile can’t answer this.
Q. The hourly time frame support at 213, 210.. that part is confusing?
A. 213-216 is a zone where most of the volume got added, i.e a lot of traders think that perhaps this is a good price to enter, hence when the stock will retrace to this level you will see it will act as a support.
One can get a clear view of the understanding of the chart is zoomed down to lower timeframes of 10M. Refer to the picture below –
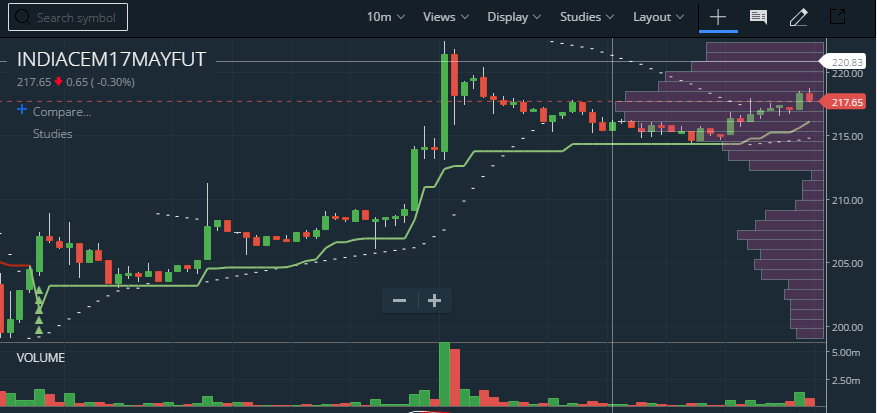
Now if price breach that level then you can see a downward breakout and it should continue till next Volume Profile support. Just keep in mind this is trading and nothing works 100% all the time, these are just signals just like an indicator and it can go south, the real magic is when it is combined with other clues in the market, then the accuracy is more solid!