Standard Deviations

Standard deviation is a critical tool in understanding and managing risk in the stock market. It helps investors assess the volatility of individual stocks, indices, and portfolios, aiding in informed decision-making and the construction of well-balanced investment strategies.
I suspect that the majority of market participants haven’t thought much about the statistical concept of standard deviations since their university days. While statistics may have seemed dry and dreary in college, a necessary evil on the way to education when applied to the markets that we all have a passion for trading they are really quite fascinating.
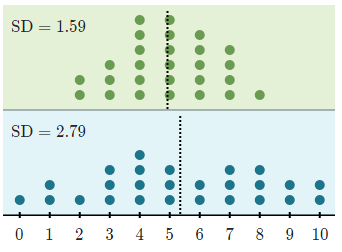
Standard deviation measures the spread of data distribution. The more spread out a data distribution is, the greater its standard deviation. For example, the blue distribution on the bottom has a greater standard deviation (SD) than the green distribution on top:
Standard deviation is a statistical measure that quantifies the amount of variation or dispersion in a set of data points. In the context of the stock market, it is commonly used to gauge the volatility of a stock’s or an index’s returns over a specific period. A higher standard deviation indicates greater price variability or volatility, while a lower standard deviation suggests more stability and less price fluctuation.
Dispersion is the difference between the actual value and the average value. The larger this dispersion or variability is, the higher the standard deviation. The smaller this dispersion or variability is, the lower the standard deviation.
Example of Calculation of Standard Deviation
Interestingly, the standard deviation cannot be negative. A standard deviation close to 0 indicates that the data points tend to be close to the mean (shown by the dotted line). The further the data points are from the mean, the greater the standard deviation.
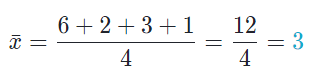
Mean means an average of the numbers.
First, we need a data set to work with. Here’s a good one: 6, 2, 3, 1
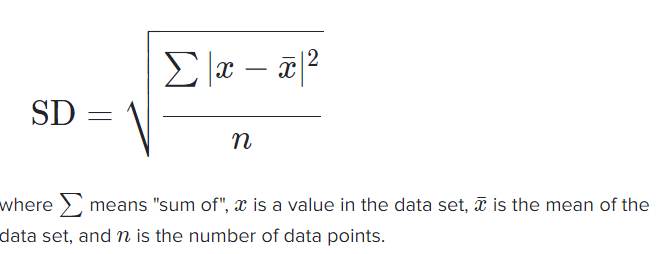
The formula for the standard deviation (SD) is
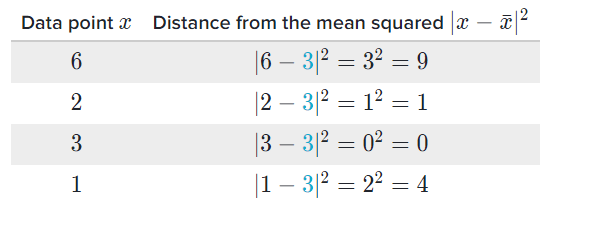
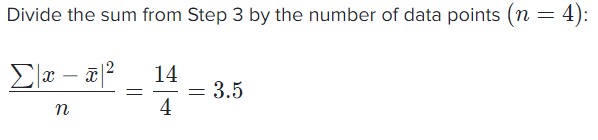
The standard deviation is the square root of 3.5 is 1.87.
The higher the deviation, the more it tends to get attracted towards the mean. In this case, it is a median Bollinger. But it’s not actually a median. It’s mean.
Volatility in the Stock Market
Volatility is a fundamental characteristic of the stock market. It refers to the degree of variation in the prices of stocks or indices over time. Stock prices do not move in a linear or predictable fashion; instead, they fluctuate due to various factors, including economic news, corporate earnings, geopolitical events, and investor sentiment.
Measuring Volatility with Standard Deviation
Standard deviation is a powerful tool for quantifying this volatility. When applied to historical stock returns, it helps investors and analysts understand how much a stock’s or a market’s returns have deviated from their average (mean) returns.
- The larger the standard deviation, the wider the range of price movements, indicating higher volatility.
- Conversely, a smaller standard deviation suggests more stable, less volatile returns.
Risk Assessment with Standard Deviation
In the world of investing, risk is a central concern. Investors generally seek a balance between risk and return. Standard deviation assists in assessing and comparing the risk associated with different stocks or portfolios. A higher standard deviation implies greater risk, which may translate into the potential for higher returns but also the possibility of significant losses. A lower standard deviation indicates lower risk but may offer more modest returns.
Portfolio Diversification with Standard Deviation
Standard deviation also comes into play when building diversified investment portfolios. By including assets with low or negative correlations, investors can reduce the overall portfolio standard deviation. This diversification helps mitigate the impact of individual stock or asset volatility and enhance the risk-return profile of the portfolio.
Volatility Trading with Standard Deviation
In addition to its role in risk assessment and portfolio management, standard deviation is integral to volatility trading strategies. Traders and investors use volatility indices (such as the INDIAVIX for the NIFTY 50) and related financial instruments to take positions based on their expectations of future market volatility. These strategies rely on standard deviation and other statistical tools to make informed decisions.
Limitations and Caveats
While standard deviation is a valuable metric for understanding stock market volatility, it does have limitations. It assumes that returns follow a normal distribution, which may not always hold true, especially during extreme market events. Additionally, past volatility may not necessarily reflect future volatility accurately.