Moving Average

- What are moving averages?
- How a moving average can be used?
- How you can use multiple moving averages to define trends
- The different types of moving averages
- How moving averages can be used as support and resistance
- And finally, how to use a moving average crossover to find trend changes
What are moving averages?
Let’s start by defining what a moving average is! A moving average displays the average value of an asset over a set period of time.
So, for a 20-day moving average, the last 20 closing prices for each day are taken and added together, then divided by 20, giving the average closing price over the last 20 days. This price is then plotted on the chart.
How a moving average can be used?
Moving averages are used to smooth out price action.
They help –
- to interpret information such as the current trend direction and
- how strong that trend is.
- When you use shorter periods, such as 10- or 20-period moving averages, they react more quickly to the changing market sentiment. However, the signals are less reliable.
- When you use longer period moving averages, such as the 50- or the 200-period, the signals are more reliable, however, they react more slowly to the price action.
- The shorter 10-period moving average travels closer to price giving more signals, but prone to more false signals.
- The medium 20-period moving average will appear smoother with fewer trading opportunities presented.
- The longer 50-period moving average is the most reliable as it gives fewer false signals but reacts to price changes much slower.
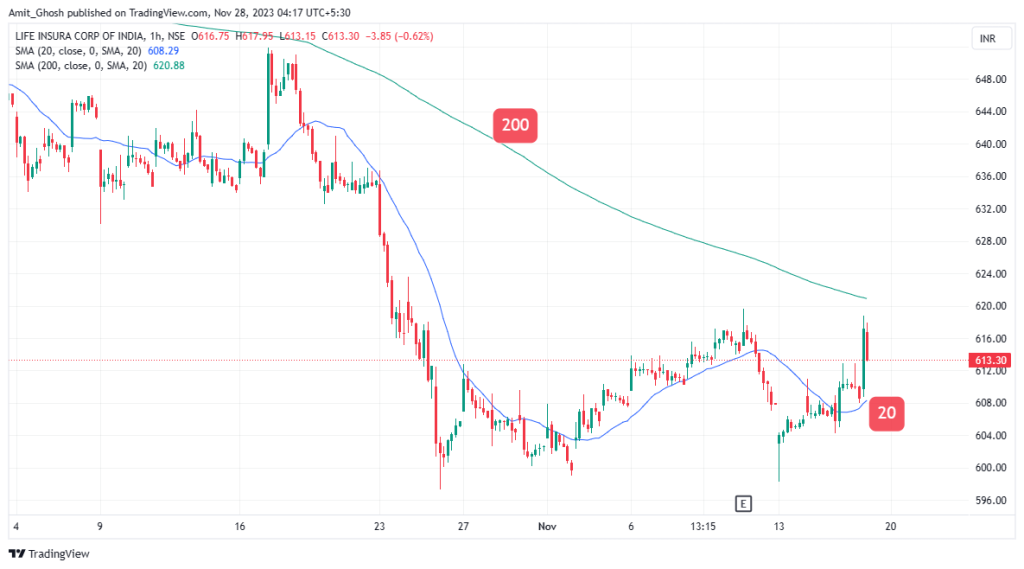
From the chart, you can see a 20-period moving average and a 200-period moving average.
The 20-period moving average is indicating that there is an uptrend at this time because it is faster in generating signals. A small change in price action will affect the direction of this shorter period moving average Whilst the 200-period moving average is indicating a downtrend because it is slower in generating signals and the direction of the moving average is based on longer term price action.
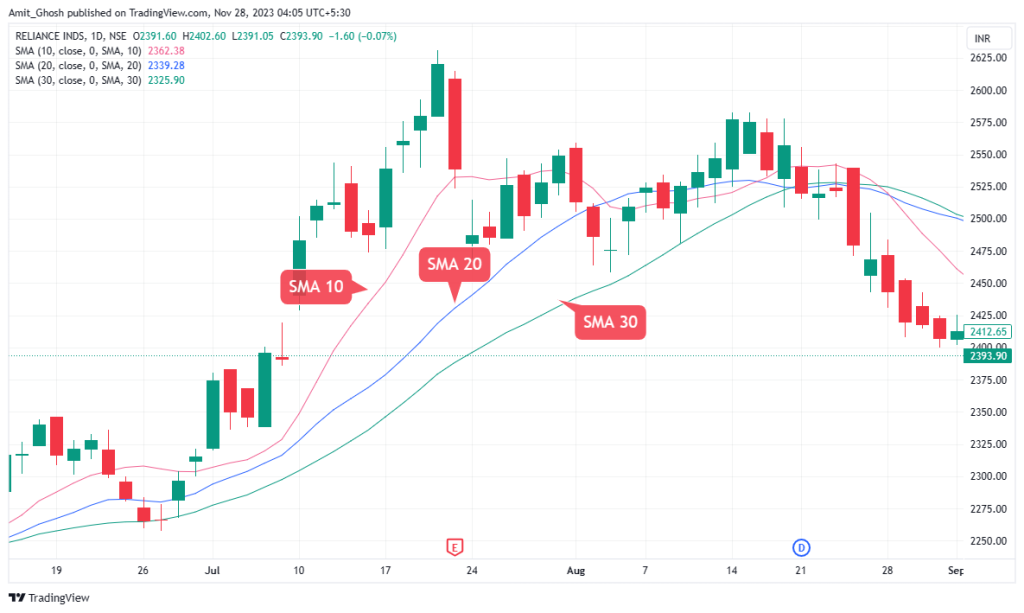
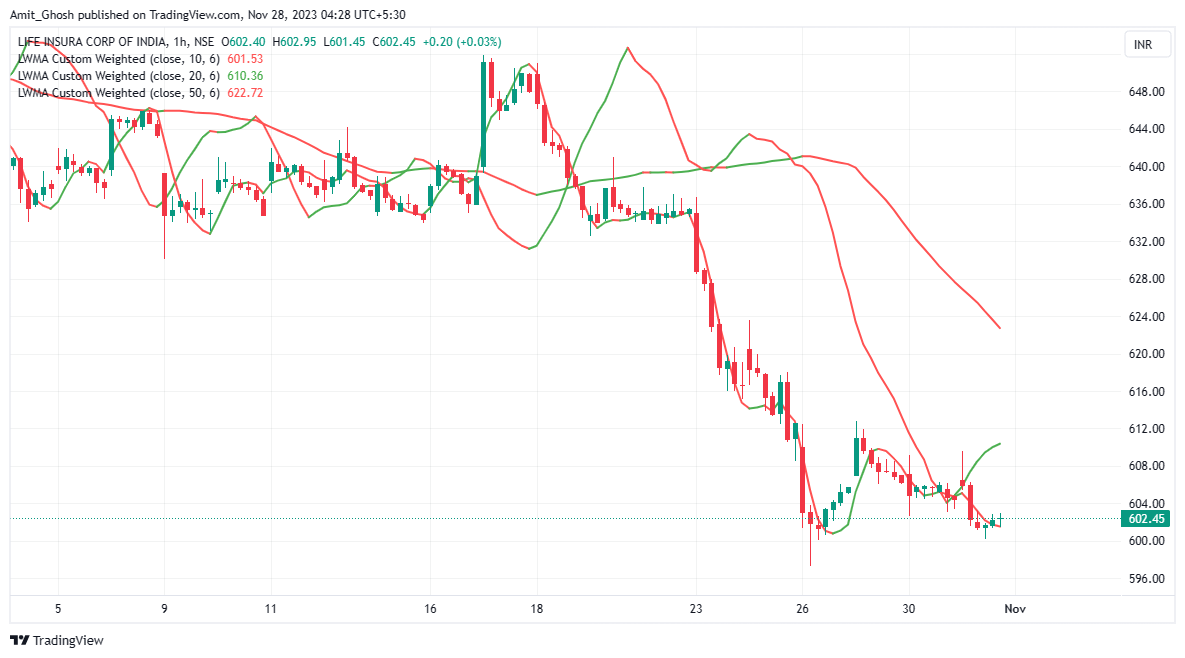
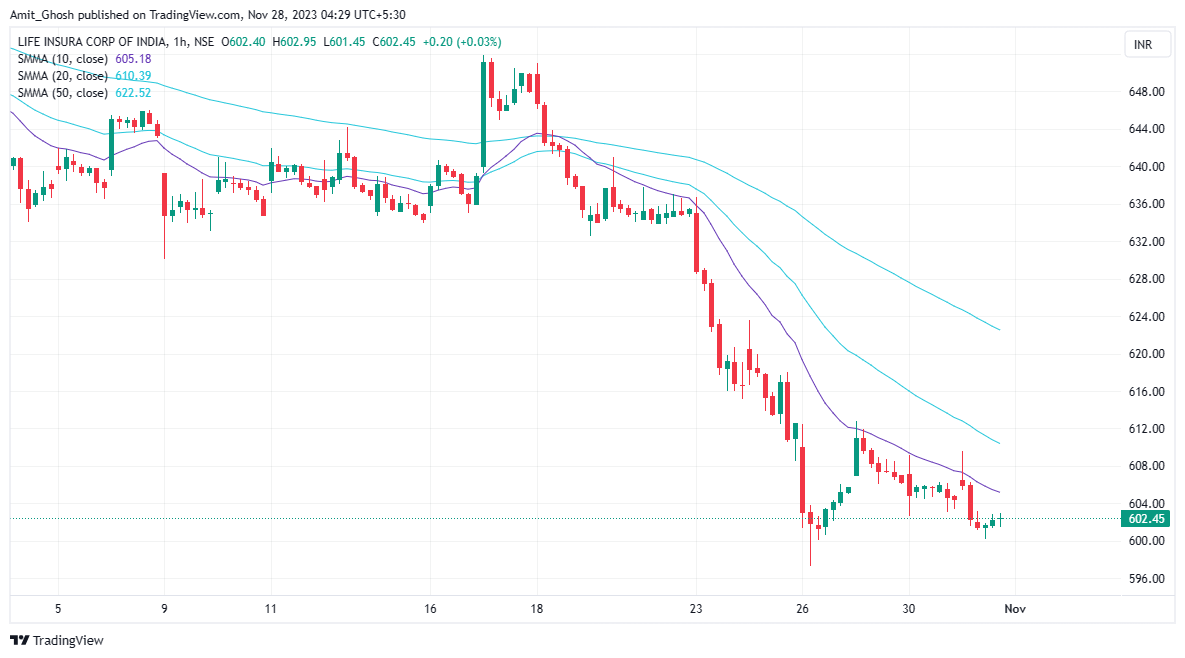
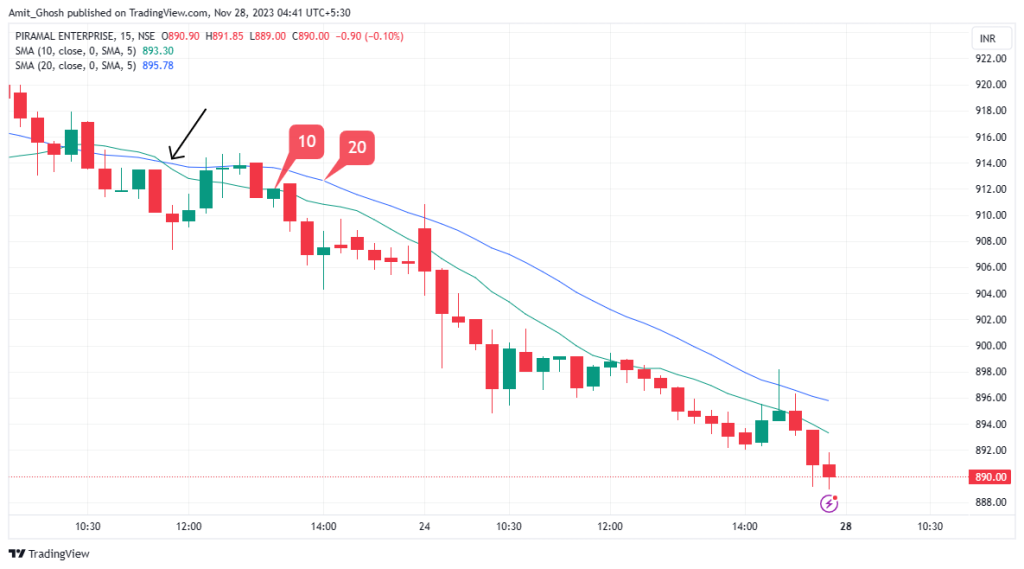
How you can use multiple moving averages to define trends
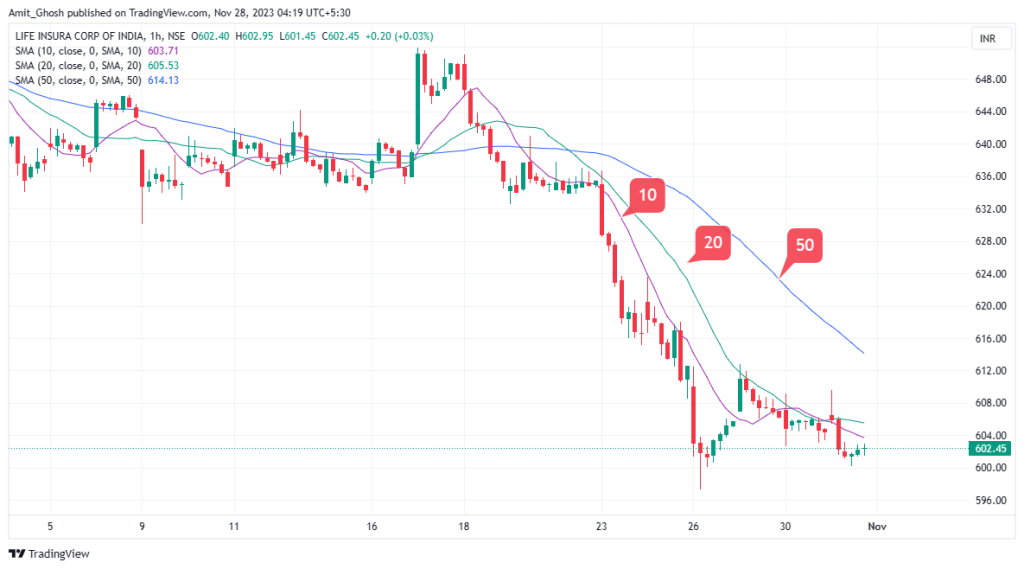
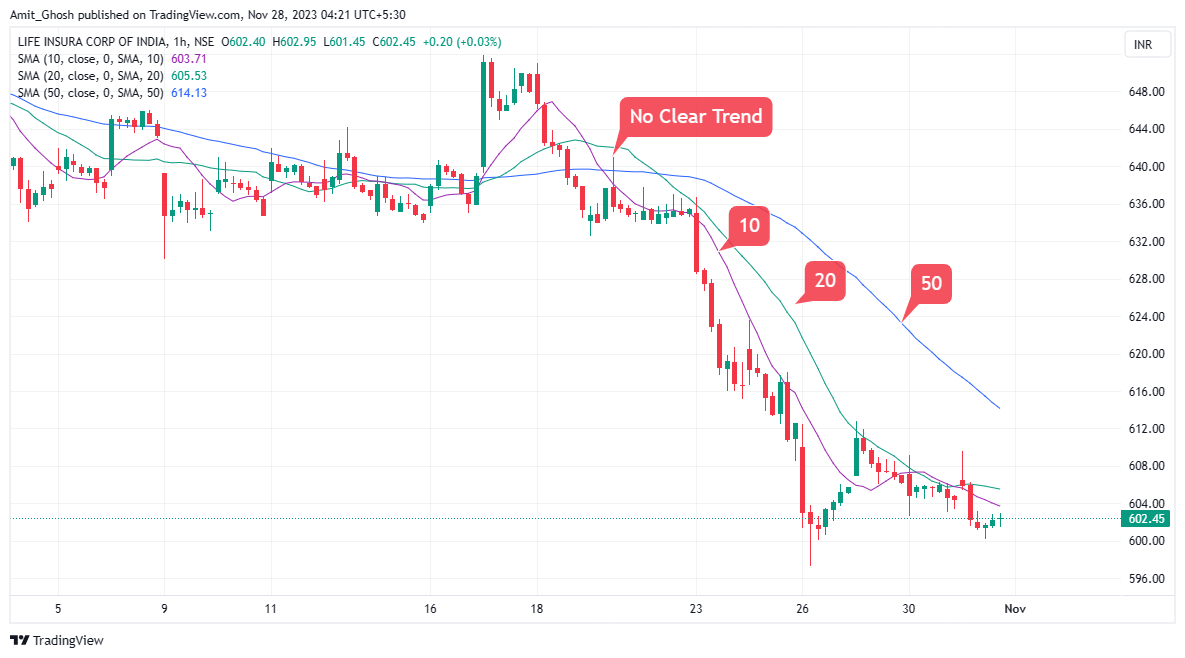
When there is no prevailing trend, the moving averages are intertwined, as you can see at the beginning of the chart. As the market enters into a downtrend, the moving averages cross over and align in order of the periods.
This is displayed in the later part of the chart.
The 10-period moving average is closest to the price, followed by the 20 and then the 50-period moving average. This is an easy way to indicate that the trend has been established.
The different types of moving averages
The Simple Moving Average, for example, places equal emphasis on each closing price from each period. Others put more weight on the most recent data points, such as
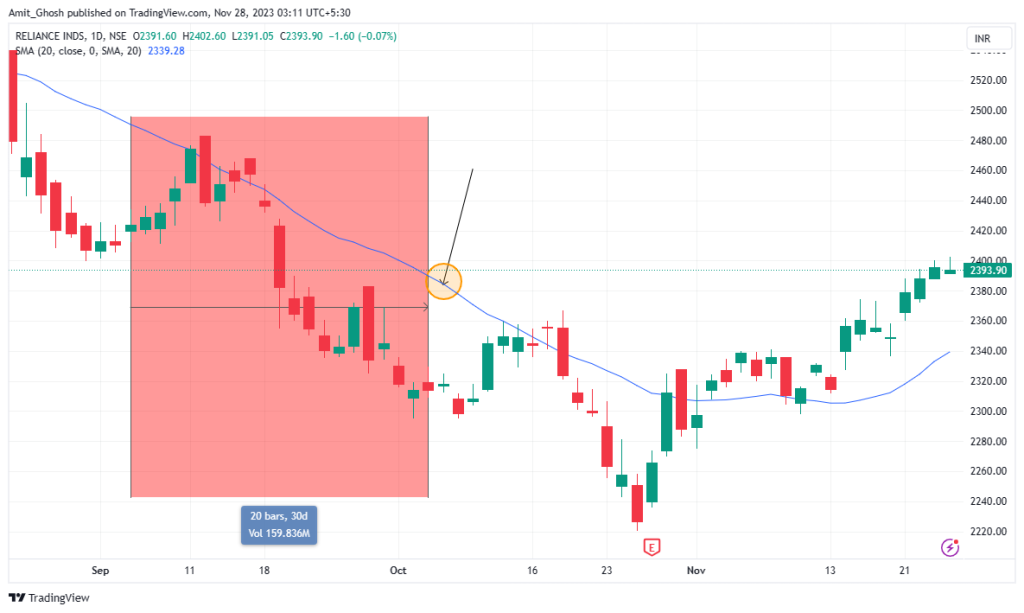
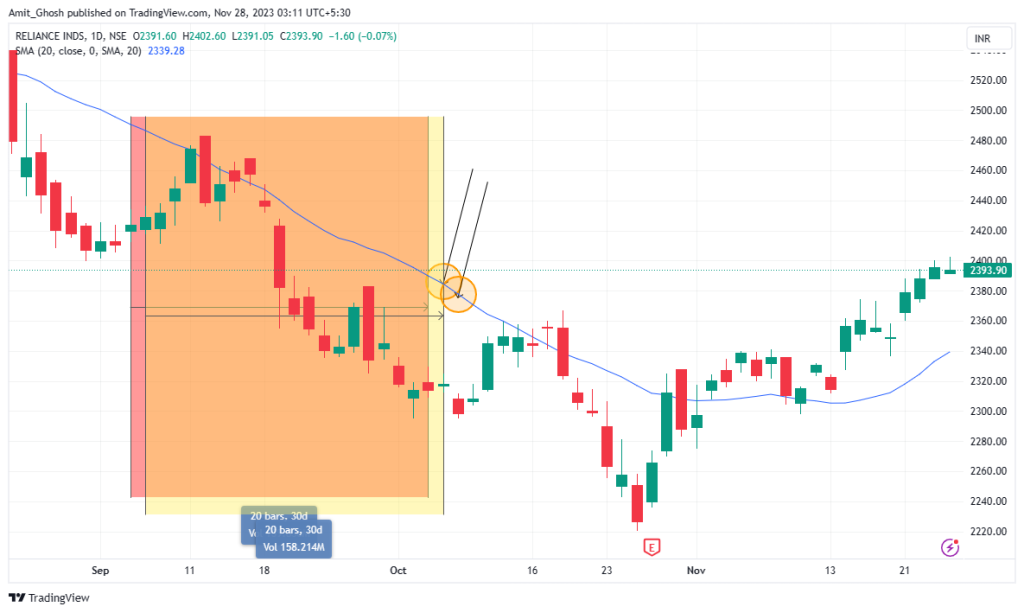
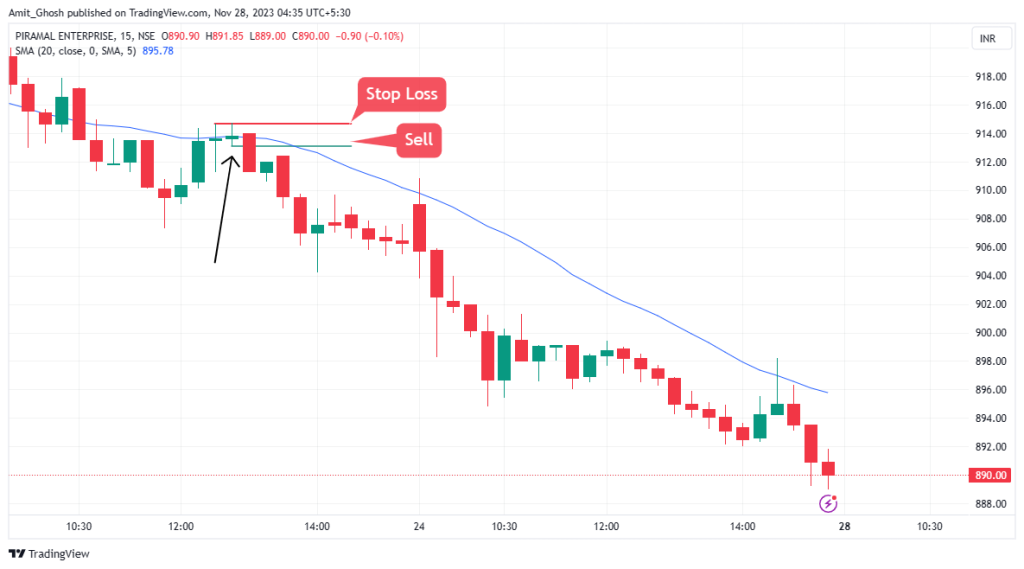
Moving averages can also be used as support and resistance
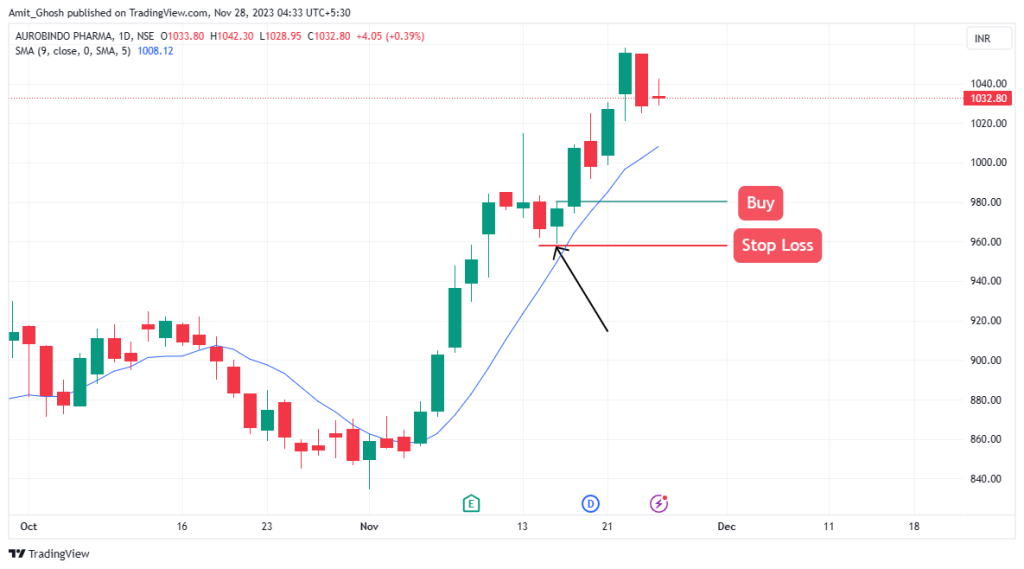
This illustration shows a moving average being used as support.
In an uptrend, you enter into a long trade when the price touches the moving average, which acts as support. You put your stop loss underneath the moving average.
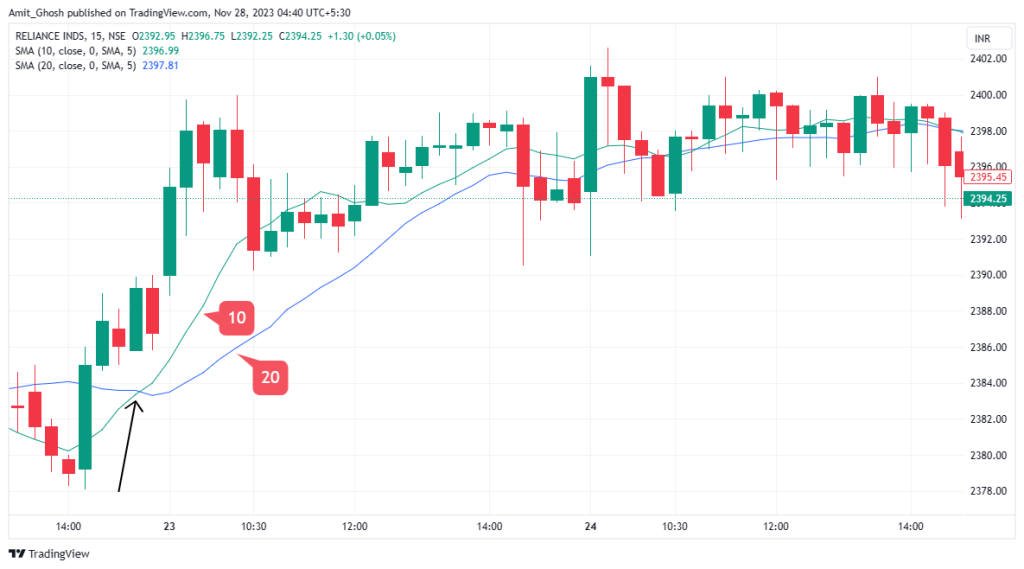
Moving Average Crossovers
Moving averages can also be used in conjunction with one another to identify a change in the trend.
These are called moving average crossovers.. You can do this by using two different period moving averages, for example, a shorter 10 period moving average and a longer 20 period moving average. Look for when they cross each other.
Conclusion
- A moving average is the average price of an asset over a specific period of time.
- A moving average can be used to determine the trend as well as gauge how strong the trend is.
- There are four different types of moving averages, each calculated slightly differently.
- There is a trade-off between the reliability of a slower moving average versus a faster moving average in how quickly they react to a change in trend. [When you determine the trend using a moving average, you must take into account the period setting of the moving average used. The trend is relative to the period setting you decide to use.]
- Moving averages can also be used as support and resistance to enter or exit trades.
- You can use multiple moving averages to identify a trend already underway, or determine a potential new trend by watching for a moving average crossover using different period settings.