Implied Volatility of a Stock – Calculations and Misconceptions

- Implied Volatility is an estimate of expected movement in a particular stock or security or asset.
- It basically tells what the market is “implying” about the volatility.
- It is derived from the price of an option in the market.
- The price of the options contract has to be put in the Black-Scholes formula.

 |
= | call option price |
 |
= | CDF of the normal distribution |
 |
= | spot price of an asset |
 |
= | strike price |
 |
= | risk-free interest rate |
 |
= | time to maturity |
 |
= | volatility of the asset |
Although the above formula looks scary, The volatility component gets reverse calculated from this equation as We know the rest of the variables.
Misconception:
- There is nothing called “IV of NIFTY”. Because NIFTY being an index can not have any IV.
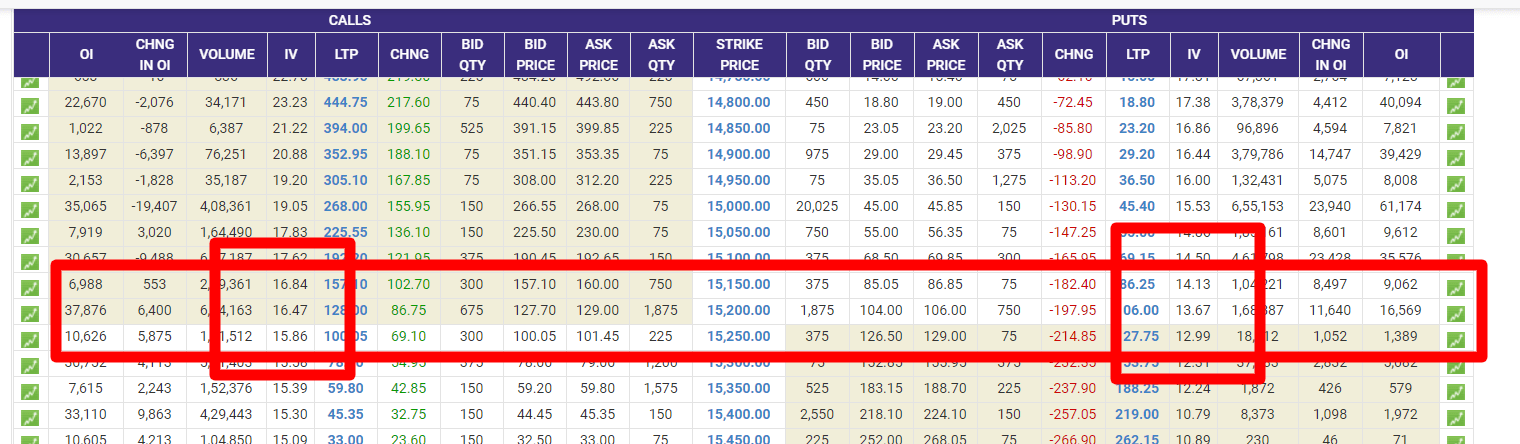
- Now, Lets’ open the options chain of NIFTY from NSE.
- You can see here – Nifty Max Pain. In this page, We derive from NSE’s data feed only.
You can also see from here – NIFTY Options Chain that, You can actually put any stock’s name on the site and click on “Option Chain” as marked.
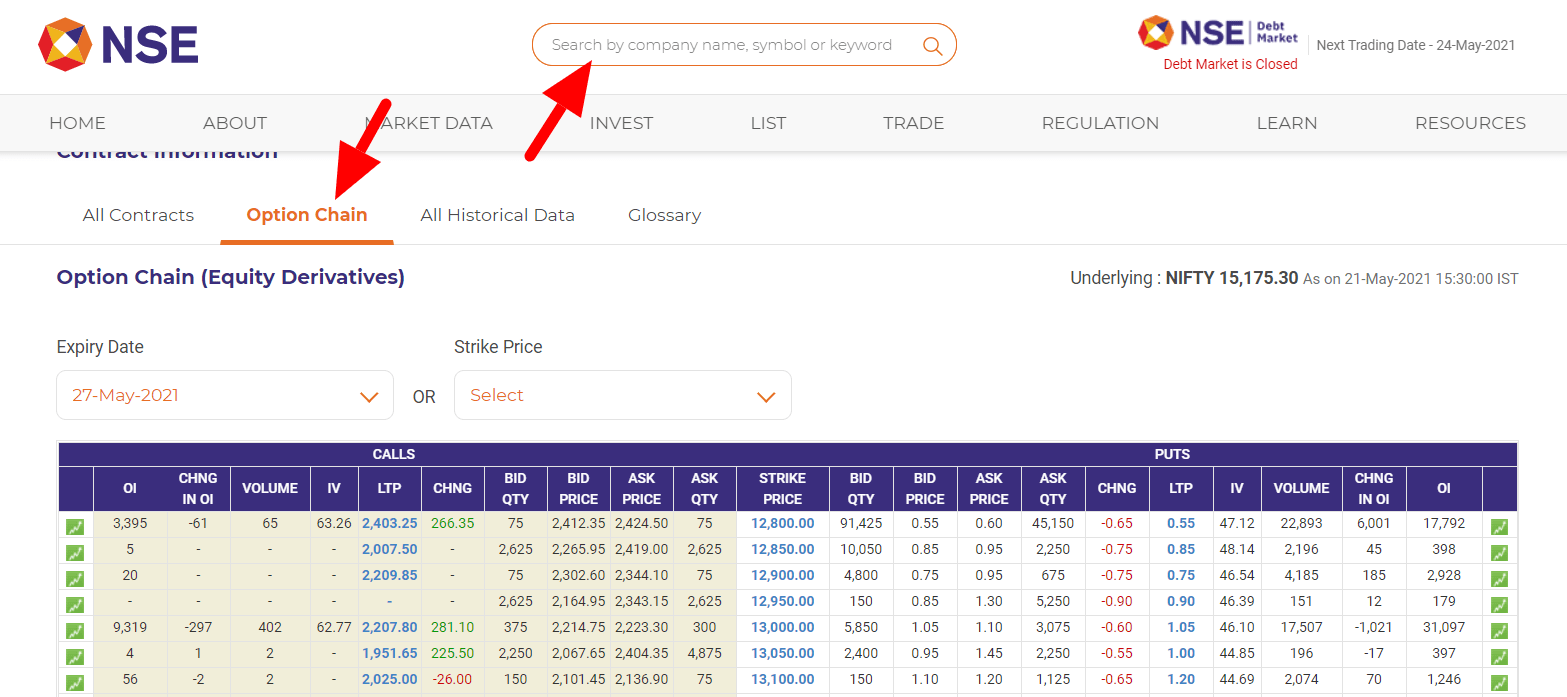
Do note – They often change the website so, it might require slight-bit browsing depending on when You’re reading this article.
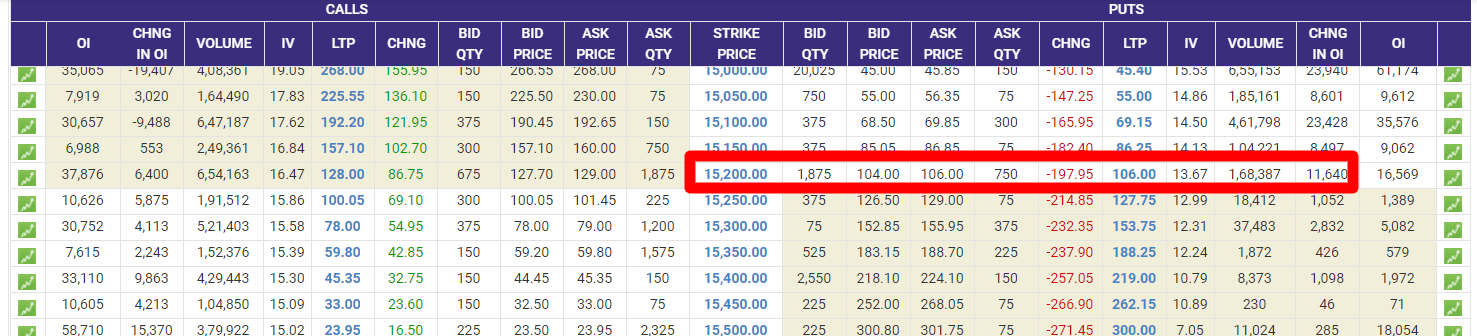
- Anyways You can see the IV of 15200PE is 13.67
- Now, This is the option chain of this monthly expiry. If the expiry shifts, the IV will be also different!
- So, IV of Nifty May 15200PE is 13.67.
There is nothing called “IV of NIFTY”.
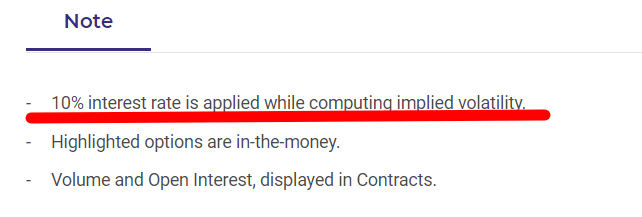
Also, it is flawed. If you scroll down on the same page of the NSE Option Chain. You will see this – 10% interest rate is applied while computing implied volatility.
Implied Volatility Rank (IVR) and Implied Volatility Percentile (IVP)
IV Rank = Measurement of current IV from 0 to 100 range based on its yearly high and low IV.
IV Percentile = Percentage of days over the past year that was below the current IV.
So, Suppose NIFTY’s yearly high IV is 25.
Wrong Statement
So, Suppose IV of Nifty 15200PE ‘s yearly high is 25. Now, if the IV of 15200PE comes someday as 30. It will show an IV Rank of 100. Right?
- Now, Assume it comes 50 in the next day. It will again show 100. This is a problem!
- If each day the IV comes more than the previous day, it will keep showing 100.
- However, the IV percentile would fall, as this high IV becomes becomes “new normal.”
- So, when a market’s implied volatility personality changes, the IV percentile will be the first to let you know.
- IV percentile doesn’t suffer from the flaw of IV rank after an abnormally large increase in implied volatility.
- IV percentile takes account of the recent changes, tells you more of the story, and assumed to be a “mean-reversion” indicator.

As told before,
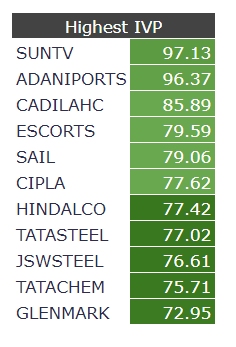
IV Percentile = Percentage of days over the past year that was below the current IV.
So, the Percentage of days over the past year that was below the current IV of SunTV is? 97.13
We are talking IV of a stock which is like IV of NIFTY. How that is possible?
Now, By IV of NIFTY, many traders approach this idea in a different manner. So, this is a very confusing parameter which You need to carefully read!
Way 1: Taking Average of ATM PE and ATM CE
IV of NIFTY
= (IV of ATM NIFTY PE + IV of ATM NIFTY CE)/2
Way 2: Taking Average of ATM PE and ATM CE along with one above strike and one below strike
NIFTY’s strike difference is 50
IV of NIFTY
= (IV of ATM NIFTY PE + IV of ATM NIFTY CE + IV of ATM+50 NIFTY PE + IV of ATM+50 NIFTY CE + IV of ATM-50 NIFTY PE + IV of ATM-50 NIFTY CE )/6
The above formula may seem headache because it looks like headache but once You see the option chain it is easy –
Anyways, IVs of near ATM strikes are almost the same.
Strike difference means the difference between two strike prices. You can see from the options chain easily that it is 50.
Note: ATM IV means IV of ATM PE + IV of ATM CE.
Way 3: Many believe to take the current expiry’s ATM, next expiry’s ATM, and hence, so-called all the available option chain’s ATM IVs all together and average it.
But, Way 3 is both good and bad because most of the time, apart from the nearest expiry, the other expiries have low volume and illiquidity which can generate skewed results.
If you have 5 students with an average of 3-foot height and then another student comes with 7-foot height. It’s abnormal.