How to trade with Volume Profile Indicator

What is Volume Profile
Let’s keep these three concepts in mind – Price, Time, Volume.
Volume is defined as, “the number of shares or contracts traded in a security or an entire market during a given period of time.” What this means is that each time a person sells or buys shares of a stock, that is considered volume.
To calculate volume, simply add the traded shares for each order on the fly. For example:
- Trader 1 Buys 100 shares of stock
- Trader 2 Buy 500 shares of stock
- Trader 3 Sells 1000 shares of stock
Total volume is then 1,600 shares for this sequence. Again volume increases regardless if it is a buy or sell order. Do you also notice stocks are not a zero-sum game because a trader can hold a stock forever? But Derivatives are zero-sum game! Because derivatives automatically expire at the end of the contract time.
- Volume Histogram ( or, Volume Chart) shows you the volume of trades executed of the scrip at a particular time.
- Volume Profile ( or, Market Profile) shows the volume of trades executed by the scrip at a particular price.
NB: Volume Profile Indicator is also known as Market Profile Indicator
Here is an example of Volume Histogram –
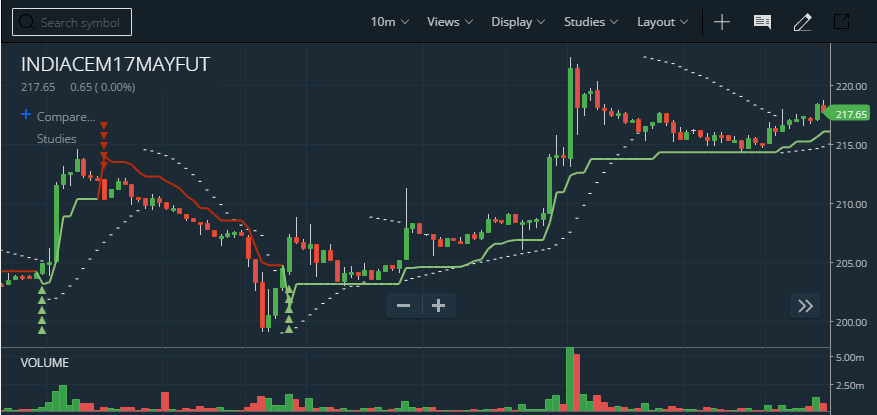
For reference, in this chart – The time frame is 10 minutes. So each candle is formed in every 10 mins as well as the volume below shows the traded volume in that particular 10 mins.
When the market moves on higher volume in a particular scrip; that’s important than market’s move on lower volumes. Many trading strategies have been formed which takes high volume as a confirmation.
Here is an example of Volume Profile –
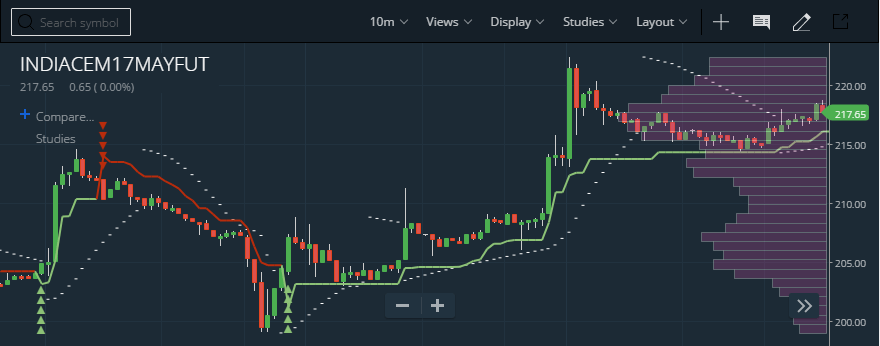
Volume Profile on a Lower time frame like 10m here is an extremely good indicator for intraday traders. Low volume on the 221, 222 zones indicate not to buy the breakout; so it discards a trading opportunity based on the breakout.
Now as breakout strategy and mean reversion complement each other; it also suggests us to look for confirmation on trading opportunity based on mean reversion.
How to interpret Volume Profile?
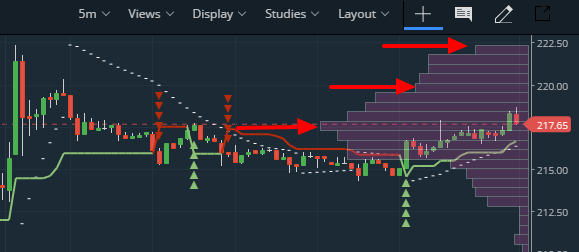
You can see the scrip is traded most at 217 zone. It’s traded medium at 220 zone and traded lower at 222.50 zone. So who traded at the 222.50 zone?
There are four kinds of transactions in the market; so there will be four types of trades which may happen there –
- Buy – Those who bought on that price band of 222.50 betting on the breakout is trapped now.
- Sell – Those who sold on that price band of 222.50 betting on mean reversion is in green now. We, at Hydrapoint, did bet on this.
- Sold Exit Complete – Those who had previously bought position from lower price bands made exit and booked profits.
- Buy Exit Complete – Those who had previously shorted position from lower price bands made exit and booked loss.
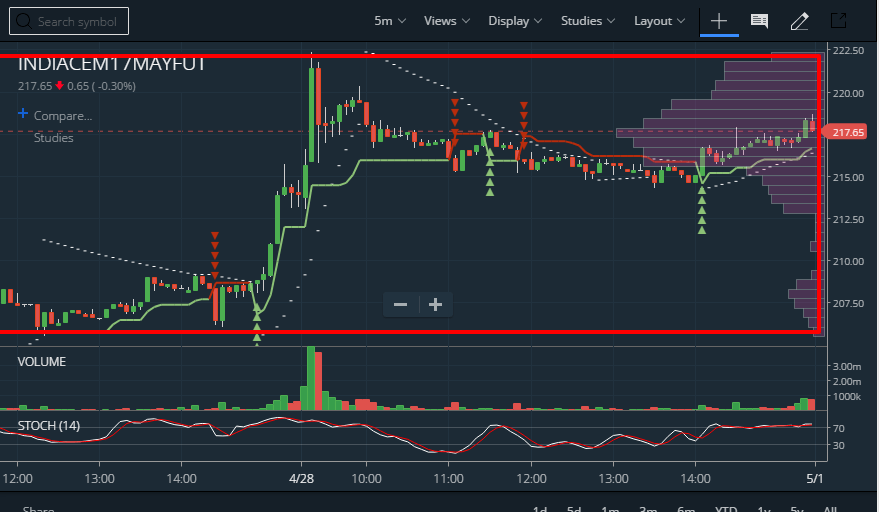
What does colour mean on Volume Histogram?
They meant that in that timeframe that candle ended in that colour. Green or Blue generally represents +ve, Red or Black generally represents -ve. It has nothing to do with volume. Just basic beautification.
You can never interpret if people bought or sold based colours of Volume Histogram or Volume Profile. That’s not what they signify. Brokers or chart-providers beautify it based on relevant candlesticks’ colour.
In the case of a Doji. Well, perfect Doji means Open-Close = 0 which is impossible almost considering the noise of the market. Most brokers consider this as red. Some broker considers this as green. Anyways it won’t matter.
Well, these red, green colours are made for beautification. If you’re satanic, you can change the colour of bull candles to red and bear candles to green. No one is stopping you! But normally people tend to take something as common. So mostly all use green or blue to colour the bull candle.
Q. The total volume for a particular price is taken for what time period?
A. You are seeing volume profile for the candles you’re seeing on your screen. Right now these candlesticks are contributing to volume profile. If you zoom out the chart, more candlesticks will fit in and hence you will see the change in volume profile too.
Q. Is there a way to get absolute values in volume profile? (like volume histogram says 0-100k shares etc.)
A. Few trading strategies inferred from Volume profile’s exact number and it is not famous as volume histogram. So brokers don’t bother.
Q. Supports are determined better by volume profiles and not by volume histograms, right?
A. Support and Resistances are sides of the same coin. When the market breaks the resistance; the resistance becomes the support and similarly when the market breaks the support; the support becomes the resistance.
So we call Support and Resistances as pivot lines. You can consider Volume Profile as a version of the leading indicator of telling where is the next pivot line. It will be support or resistance; that’s where the bet comes in.
Q. Is volume profile useful for 1 min chart?
A. Depends on your trading strategy and what you’re going to do with it. But the general answer is no. Lots of noise. A seasoned trader always prefers daily timeframe or an hourly one.