How to Determine Market Direction using Fractals

How to Determine Market Direction Using Fractals
As a trader, You can use Fractal to determine market direction. A very simple method is to look for a Broken Fractal.
A fractal is broken when –
- It has completed five candle patterns.
- And, the price then breaks the high or low of the pattern.
If the Price breaks an up fractal, the direction is considered to be Up. You will be only looking for a buying opportunity.
If the Price breaks a down fractal, the direction is considered to be Down. You will be only looking for a selling opportunity.
Note: Like any other setups of Price action, the higher the timeframe, the more reliable the indicator is.
StopLoss Placement
Another way a trader can use the Fractal is StopLoss Placement.
For example, You are running a short trade.
You can use the most recent Up Fractal to place your stop loss.
Example :
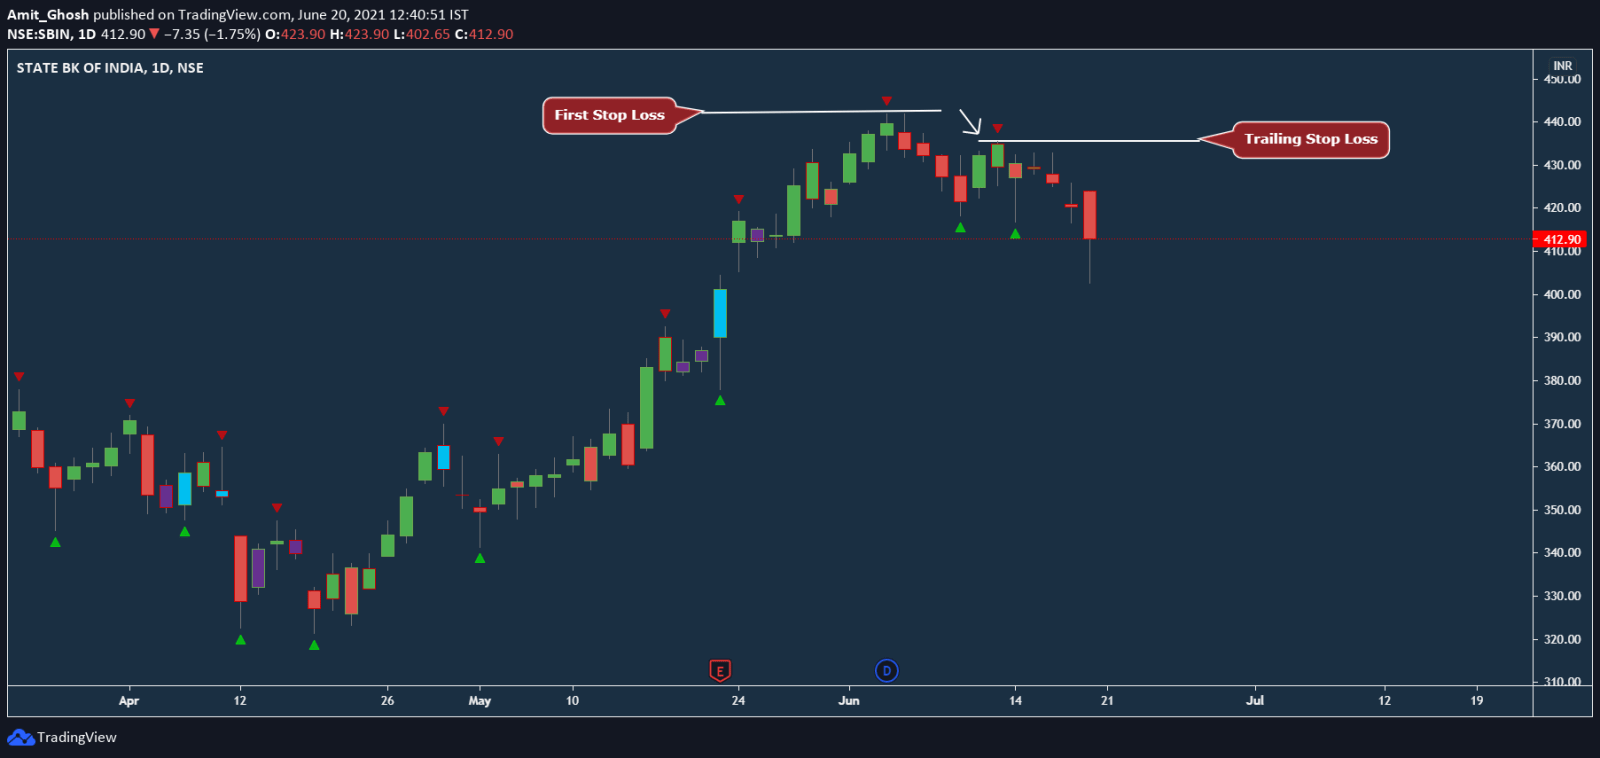
Suppose You have SBIN short for “some reason” with initial stop loss at “some point”. (It is assumed here that Your initial stop loss was at an All-Time-High of SBIN.)
Now, You can use Fractal to trail the stop loss!
The most recent Up Fractal is used as Current StopLoss.
Note:
This is an “exit strategy” discussion only when We are talking about Stop Loss Management.
The process of StopLoss Placement will be reversed for a Long Trade.
In that case, You will use tip of the Down Fractal to place your stop.
Recap:
- The Fractal is an Indicator that shows a potential reversal in the markets.
- They form when a particular price action occurs in a chart.
- The pattern is composed of five candlesticks.
- An up fractal forms over a candle that has two candles to the left and the right with lower highs.
- A down fractal forms under candles with two candles to the left and the right that have high lows.
- Fractal indicators can be used to determine the direction of the market when the price breaks through the highest high or the lowest low of the pattern.
- Fractals can be used to place stop losses.
Example of How to Determine Market Direction
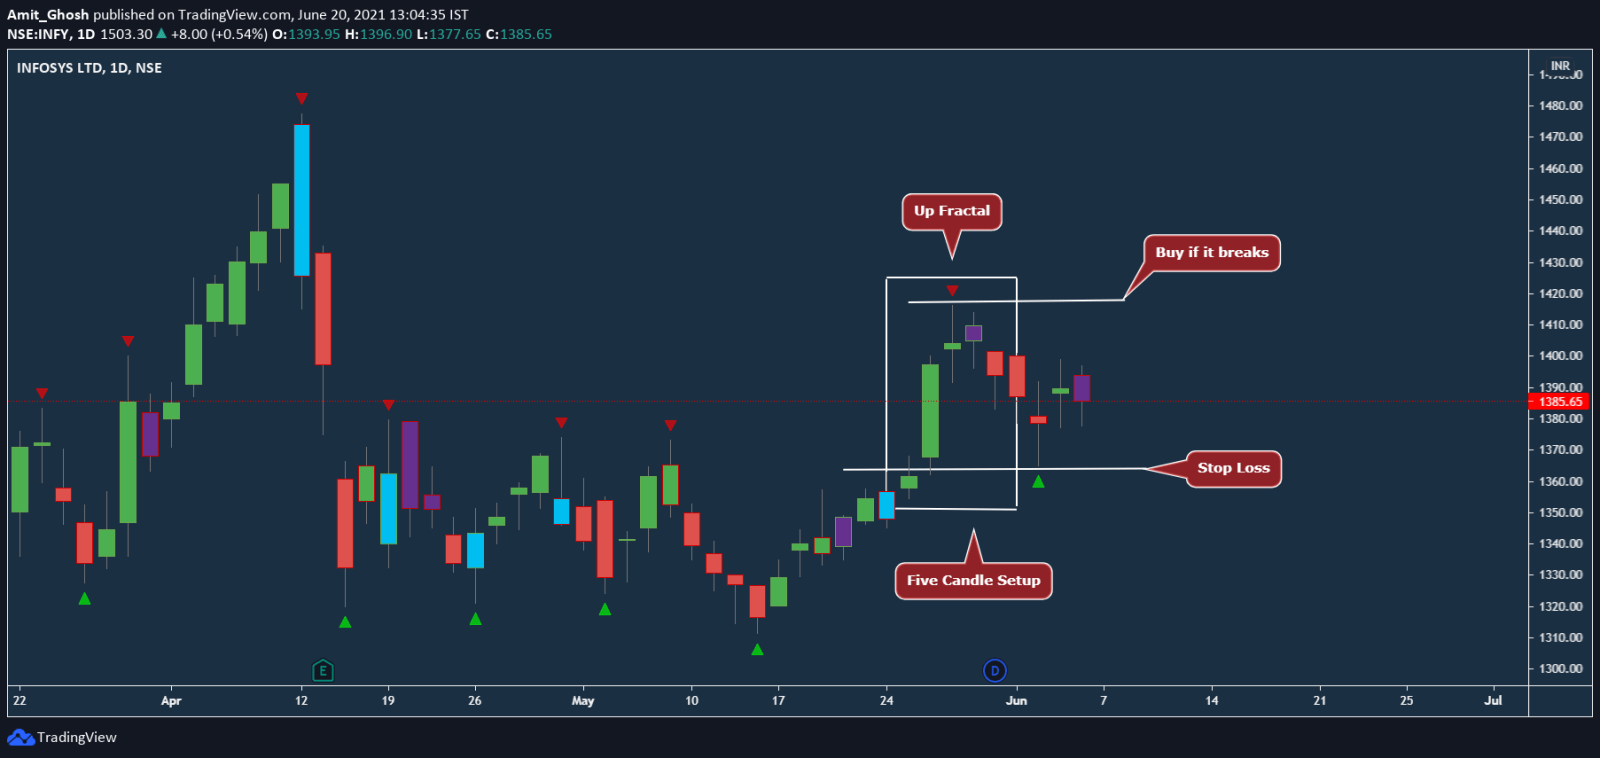
Part 1: Formation of the Trade Setup
Let’s take Infosys in a Daily timeframe –
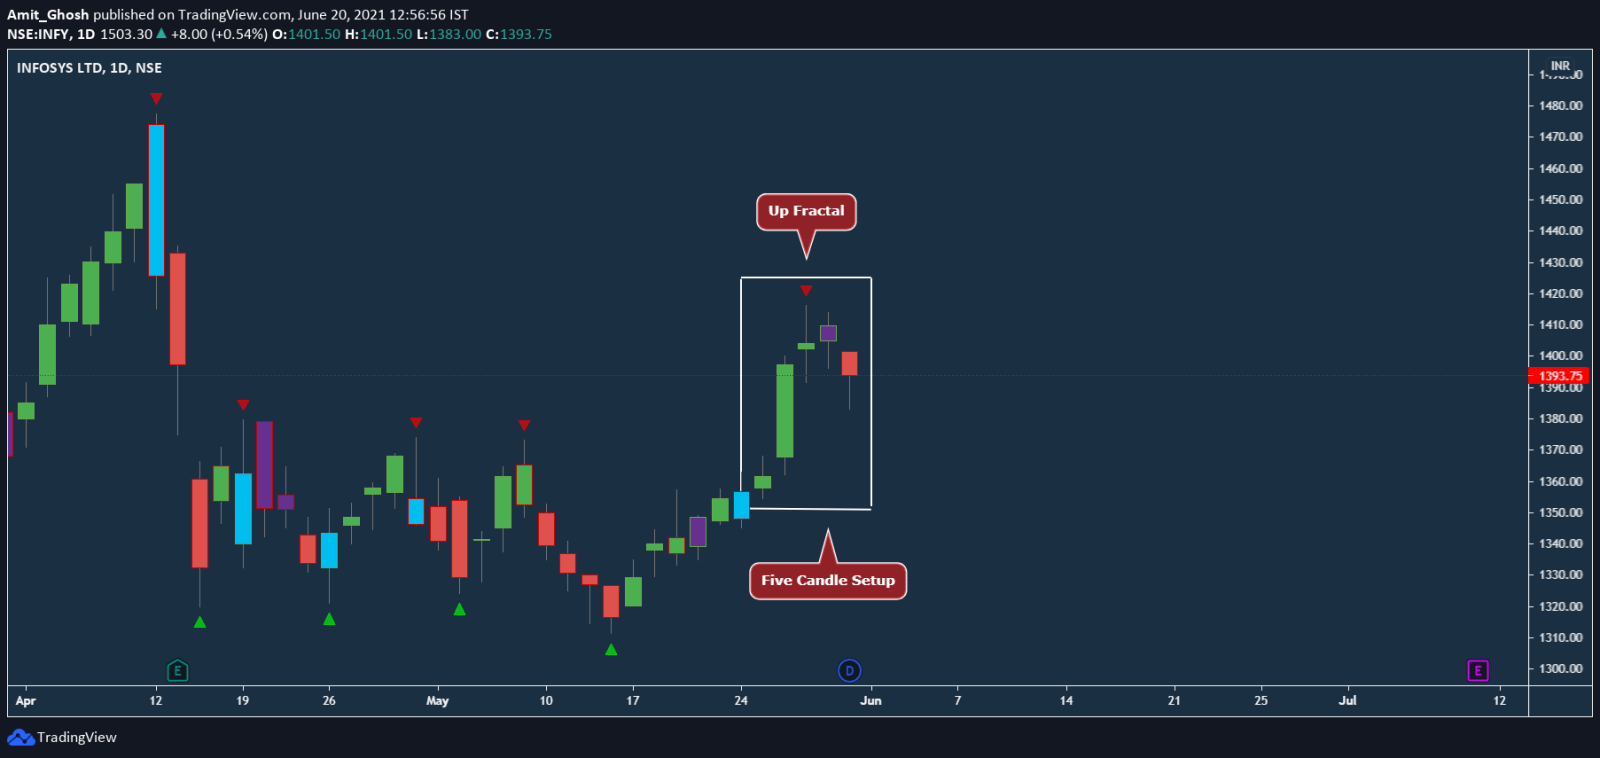
- This is an Up Fractal.
- The 5 candle setup is completed.
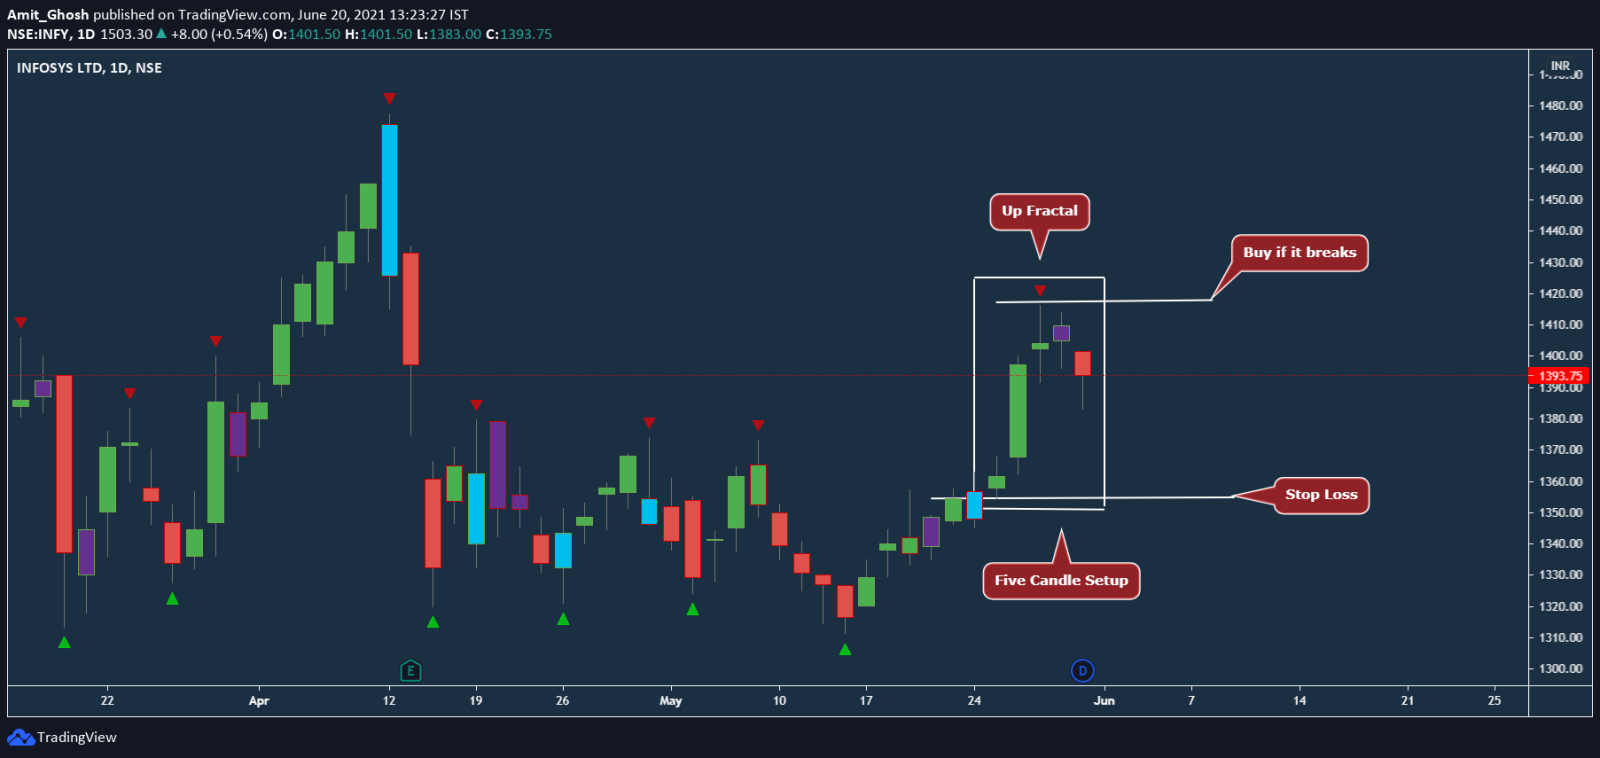
Now, From the next candle, we shall be waiting for the high of fractal to get broken. If it gets broken, it will be buy setup.
Note – We are not discussing stop loss and target but just the “entry” here at this moment.
Part 2: Stop Loss Selection in the Buy Setup
But, as We are doing Price Action, It is psychologically evident that it will not be Buy setup if the low of the entire “5 candle setup is broken”.
So, We are keeping the initial stop loss at the low of the “Five Candlesticks” (the Lowest Low of five candlesticks.)
You may also keep the initial stop loss at Low of the Last Down Fractal.
So,
- Low of the Last Down Fractal
- Low of the “Five Candlesticks”
— Whichever comes first, Your stop loss will be there!
In this case,
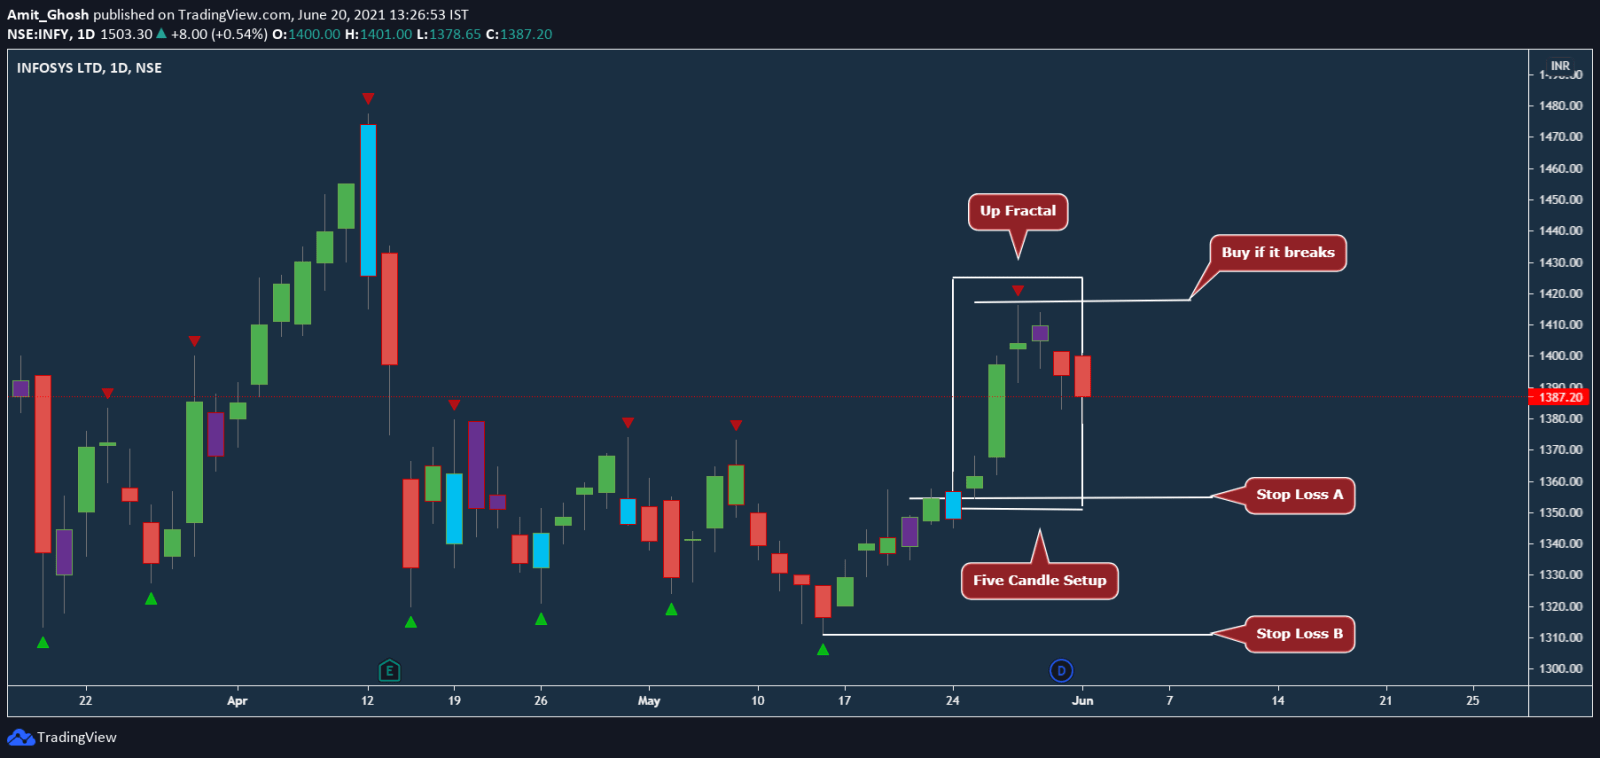
If We mark “Low of the Last Down Fractal” as “Stop Loss B” and “Low of the “Five Candlesticks” as “Stop Loss A”, We can see “Stop Loss A” is near.
So, We are using that as Stop Loss. Here goes the private link to Tradingview –
https://in.tradingview.com/chart/INFY/esu7oGLz-Infosys-Up-Fractal/
Part 3: Formation of Down Fractal/ Changing the Stop Loss
Now, After few days, the buy did not trigger! But, We get a new Down Fractal.
So, We have our new stop loss –
Note: We are changing the initial stop loss even before the trade is triggered! It is rare. Usually people trail the setup after the trade is triggered.
Part 4: New Sell Setup with Down Fractal
But, as Down Fractal is now formed, We also have a totally different setup too!
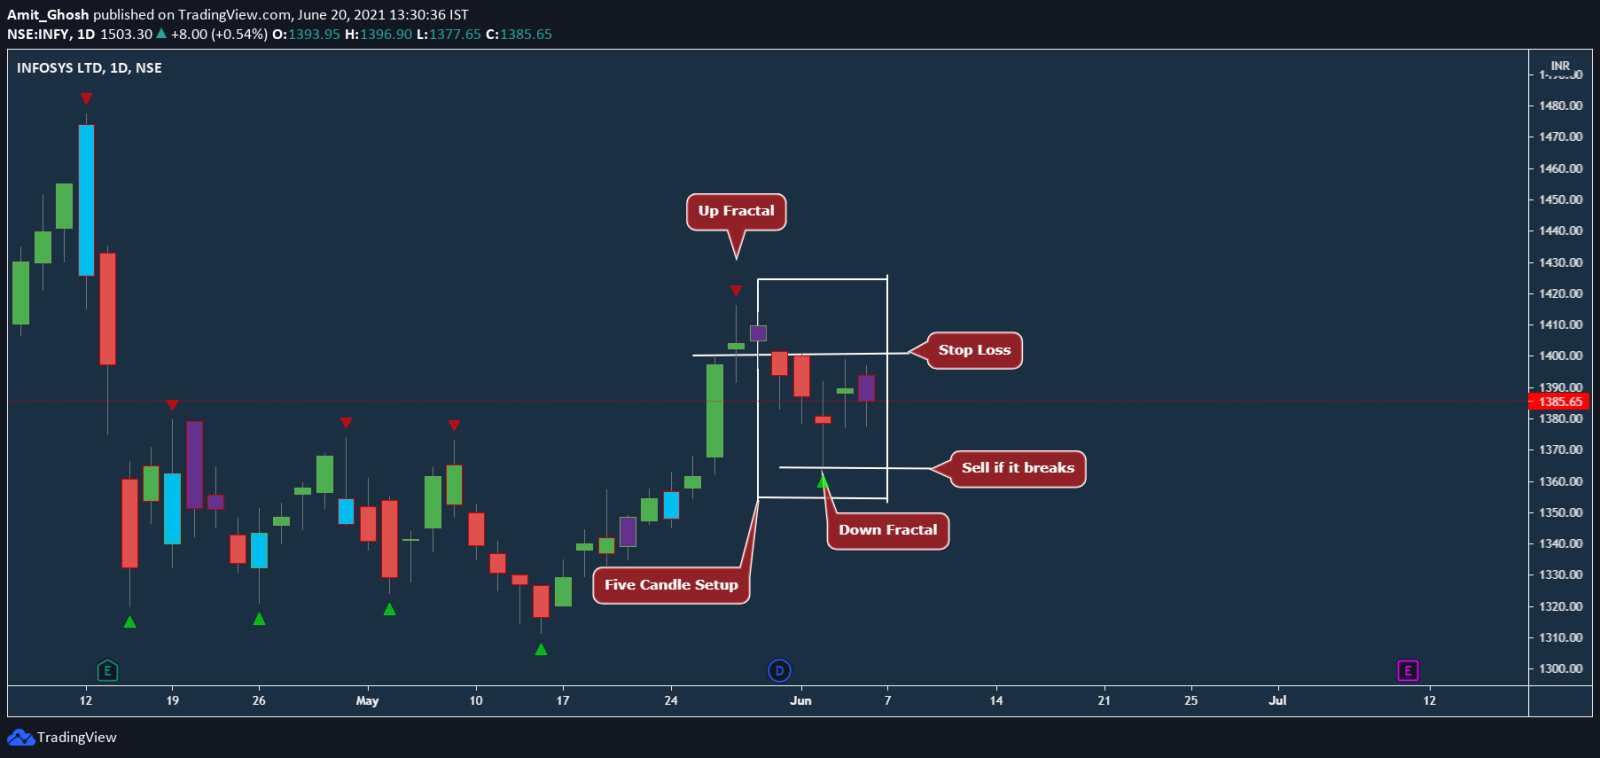
- This is a Down Fractal.
- The 5 candle setup is completed.
Now, From the next candle, we shall be waiting for the low of fractal to get broken. If it gets broken, it will be a sell set up.
Part 5: Stop Loss Selection in the Sell Setup
Note: In this case, We have also selected the stop loss based on our previous discussion –
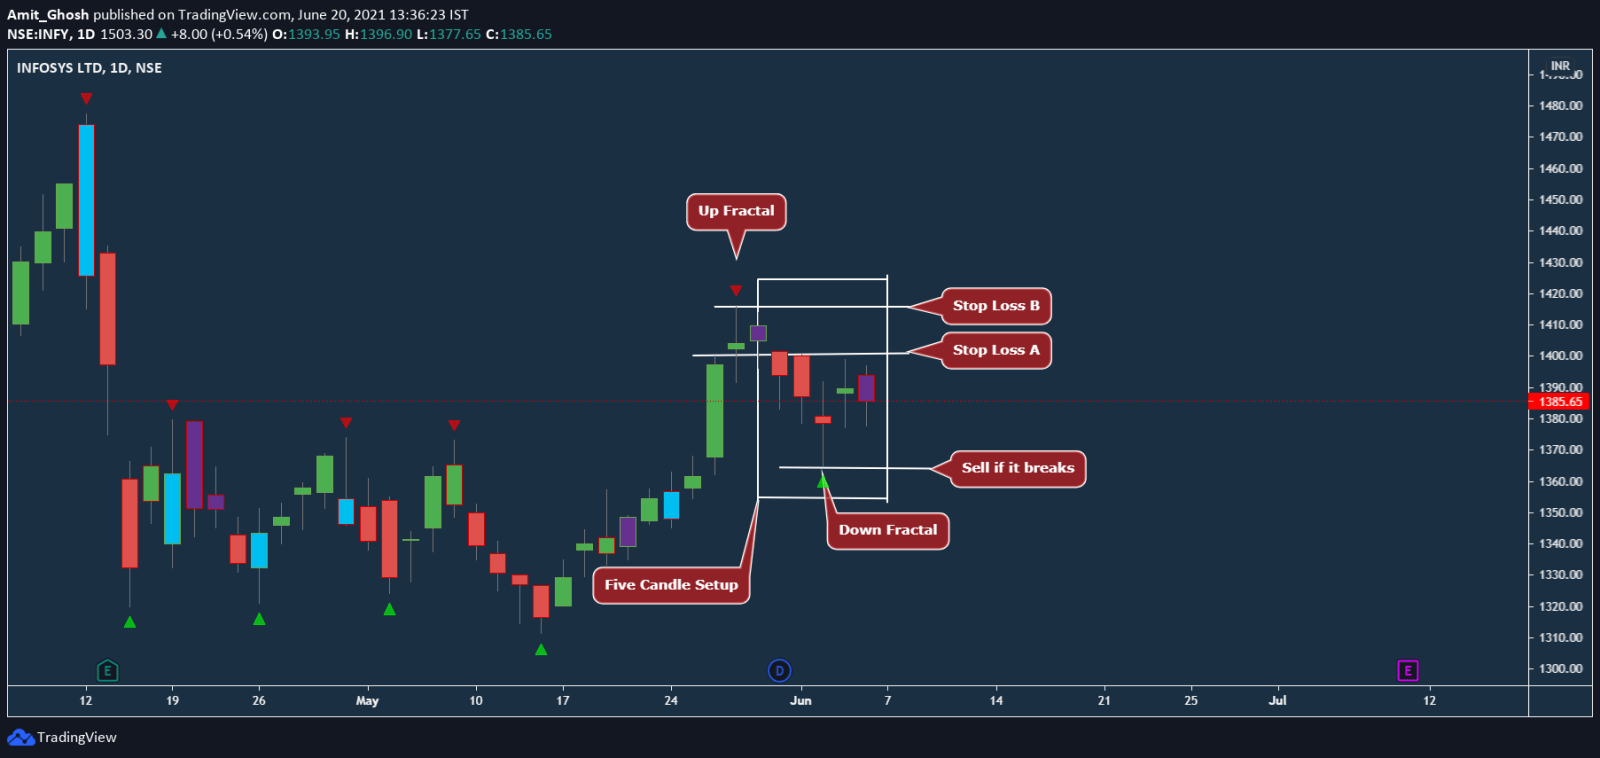
- The high of the Up Fractal is labeled as “Stop Loss B”.
- The high of the 5 candle setup is labeled as “Stop Loss A”.
Stop Loss A is lower high among them, and hence, is chosen as Stop Loss in this setup.
Here goes the private link to Tradingview of the idea which You can edit yourself and check more closely – in.tradingview.com/chart/INFY/NvsWo8xv-Down-Fractal/
Part 6: Aftermath
Now, After few days,
- The Up Fractal and Buy Setup triggered.
- The Down Fractal Sell Setup is invalidated when the Buy Setup is triggered.
The trade is in fantastic profit
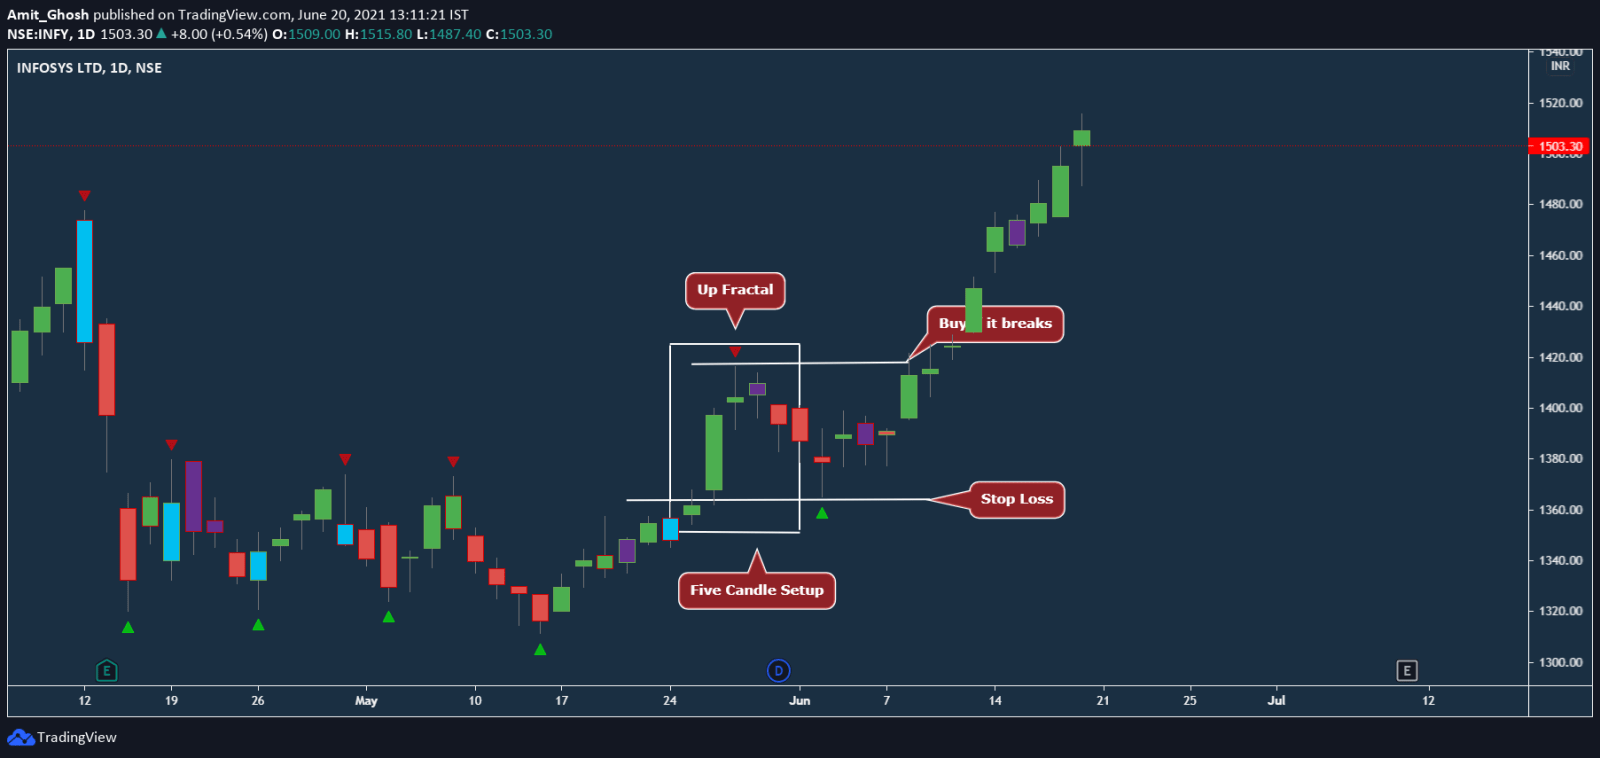
Price Action is simple and devastating at the same time.
Recap: 3 Step Method to Trade
Entry Strategy :
- Formation of 5 candle
- Formation of Up/Down Fractal
- Buy/Sell if breaks
Exit Strategy:
- Low of the Last Down Fractal
- Low of the “Five Candlesticks”
— Whichever comes first, Your stop loss will be there!
Target is using Trailing Stop Loss. We trail buy/sell trade using Down/Up Fractal.
Now You can combine other price action strategies to improve it. But, in this discussion, We will limit ourselves to only Fractals.