BRS Bollinger Bands Trading Strategy

Revisiting Bollinger Bands –
- Bollinger Bands consist of three lines: a middle line representing the simple moving average (SMA) of the price, and upper and lower bands that are typically set at two standard deviations from the SMA.
- These bands help identify potential support and resistance levels, as well as market volatility.
Bollinger Bands are a popular technical analysis tool, but it’s essential to use them wisely. Here’s how to employ the Bollinger Bands indicator effectively and choose the right trading strategy:
The First Step is to Avoid Common Misconceptions:
- Bollinger Bands should not be viewed as strict sell or buy signals when the price touches the upper or lower band, respectively.
- Prices often “walk the band,” which means they can ride along the band’s edge without a clear trend reversal.
Types of Bollinger Bands Strategies:
- Mean Reversion Strategies:
- These strategies focus on oscillations around a baseline, such as the median Bollinger Band.
- When the price touches the upper band, it doesn’t necessarily mean it’s time to sell, and vice versa for the lower band.
- Mean reversion strategies aim to capitalize on price reverting to its baseline after deviating.
- Breakout Strategies:
- Breakout strategies look for significant price movements breaking out of the Bollinger Bands.
- Riding a Bollinger Band breakout is an example of a breakout strategy.
- Breakout and mean reversion strategies can complement each other, but their effectiveness depends on the time frame.
Using Bollinger Bands to Identify Trends:
Bollinger Bands can also help identify trends in the market. In most markets, prices tend to consolidate (range) about 80% of the time, and trends are relatively rare. You can define a trend as a deviation from the norm (range)..
Constructing a Bollinger Bands Indicator for Trend Identification:
Let’s make the construction of an indicator close to Super trend with the help of Bollinger Bands. To identify trends, you can add another Bollinger Band on top of the one you already have.
Set the new Bollinger Band with the following parameters:
- Field: Close
- Period: 20
- Standard Deviations: 1
- Moving Average Type: Exponential
- Channel Fill: No (To avoid confusion and messiness, we make Channel Fill as No to previously plotted Bollinger Bands)
By combining these insights with your trading strategy, you can use Bollinger Bands effectively to identify trends and make informed trading decisions.
So Breakout and Mean Reversion Complement each other.However, it is time frame specific. What is a breakout in 1-minute time frame can fall into Mean Reversion in a higher time frame
Let’s open the Bank India May Futures in our trade setup. Also, colour 1 SD Bollinger as yellow to spot them better.
You can enhance clarity by coloring the 1 SD Bollinger Bands as yellow. Additionally, to achieve a more effective exit strategy, it’s advisable to use the Simple Moving Average (SMA) as the Moving Average Type for the 1 SD Bollinger. Your 15-minute time frame chart should then appear as follows:
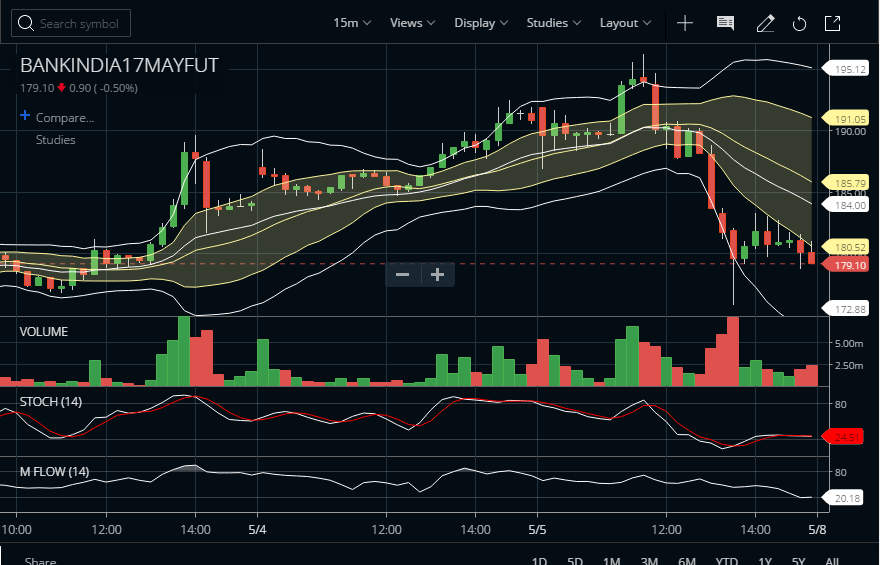
Here is our Bollinger Bands Trading Strategy #1 –
BRS Strategy
The strategy is called BRS (Bollinger Riding Strategy). To spot an uptrend and a potential buy signal:
- Look for a green candle whose close is outside the 1 SD Bollinger Band.
- The next candle should open and close above the upper band of the 1 SD Bollinger Band.
- Enter trade at the “close” of the second green candle upon the formation of the third candle.
- Close the trade when the candle touches the median of the 1 SD Bollinger Band.
This is similar to the Famous Three Crow Strategy of Price Action.
The Entropy BRS Strategy was developed by Amit Ghosh in early 2018 while discussing Bollinger Bands and Probability Distribution in the Unofficed Trading Forum.