Log-Normal Distribution

“Well asset prices follow a lognormal distribution, which is skewed to the right because asset prices are non-negative. Hence they are positively skewed! Most good stocks are positively skewed. “
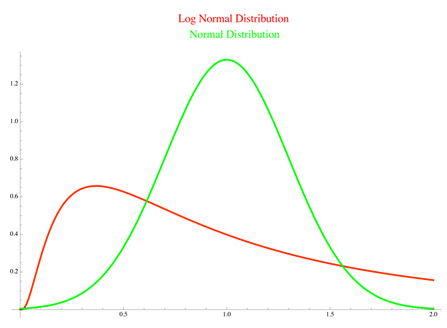
Let’s revise abit with Positive Skewness –
- Conversely, data that has a positive skewness is said to be skewed to the right.
- In the case of positive skewness (green curve here), the data piles up on the peak on the left side and the tail points right.
- Positively skewed returns mean frequent small losses and few large gains.
In probability theory, a log-normal (or lognormal) distribution is a continuous probability distribution of a random variable whose logarithm is normally distributed. Thus, if the random variable X is log-normally distributed, then Y = Log (X) has a normal distribution.
The log-normal distribution is often considered a better choice than the normal (Gaussian) distribution in the context of stock market returns for several reasons:
- Positive Returns: Stock market returns are inherently positive or zero (stocks cannot have negative prices), which is not the case for the normal distribution, which extends from negative infinity to positive infinity. The log-normal distribution is defined for positive values, making it a more appropriate choice for modeling returns on stocks and other financial assets.
- Multiplicative Nature of Returns: Stock returns are often multiplicative rather than additive. This means that investors care more about the percentage change in asset prices (i.e., relative returns) rather than the absolute change. The log-normal distribution naturally models multiplicative returns because the logarithm of a multiplicative return becomes an additive return.
- Skewness and Kurtosis: Empirical evidence shows that stock market returns exhibit skewness (asymmetric distribution) and kurtosis (fat tails) more frequently than what a normal distribution would suggest. The log-normal distribution can capture some of this skewness, making it more suitable for modeling the observed characteristics of stock returns.
- Volatility Clustering: Stock market volatility tends to cluster, meaning that periods of high volatility are often followed by more high volatility and vice versa. The normal distribution assumes constant volatility, which does not reflect this real-world phenomenon. Models like the GARCH (Generalized Autoregressive Conditional Heteroskedasticity) model are often used to account for time-varying volatility in financial data, but these models work well in conjunction with the log-normal distribution.
- Empirical Fit: Historical stock market data often exhibits a better fit with the log-normal distribution when compared to the normal distribution. While neither distribution is a perfect fit, the log-normal distribution tends to provide a closer approximation to actual stock returns.
- Option Pricing: In option pricing models like the Black-Scholes-Merton model, the log-normal distribution is assumed for the underlying asset’s price. This assumption has been widely accepted in options trading and derivatives markets.
- Portfolio Theory: The log-normal distribution is also commonly used in portfolio theory, where investors need to estimate the distribution of returns for different assets and portfolios. It simplifies calculations involving expected returns and risk assessments.
A random variable that is log-normally distributed takes only positive real values as Log (X) cannot return a negative value. The distribution is occasionally referred to as the Galton distribution.
Stock market returns are defined by Log (T/P) and hence follow a log-normal distribution.
It’s important to note that the log-normal distribution is still a simplification, and real-world financial data can exhibit complex behavior that may not be perfectly captured by any single probability distribution.
Additionally, the log-normal distribution assumes constant volatility, which is an oversimplification of market dynamics. More advanced models, such as those incorporating stochastic volatility, are often used for a more accurate representation of financial markets.
In summary, while neither the normal nor the log-normal distribution perfectly captures all aspects of stock market returns, the log-normal distribution is considered a better choice in many cases due to its ability to account for the positive nature, multiplicative returns, and some characteristics of stock market data. However, sophisticated models and techniques are often needed to address the nuances and complexities of financial markets accurately.