Average True Range (ATR) Indicator

- What the ATR indicator is.
- What the ATR indicator shows.
- How to use the ATR indicator.
Average True Range (ATR) Indicator
- ATR can help you to predict how far the price of an asset might move in the future.
- This can be helpful when deciding where to place stop losses and profit targets.
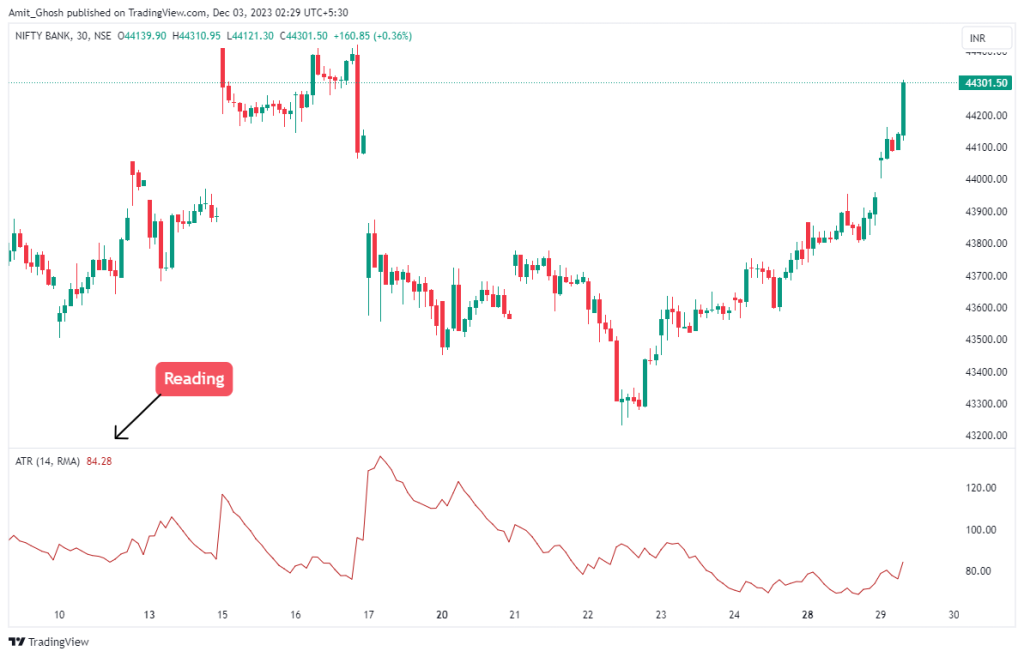
- It is represented as a form of moving average, normally calculated over 14 historic periods. The setting can vary, however, depending on your own personal strategy.
- However, unlike forex, where ATR is measured in pips, for stock indices like the Bank Nifty, the ATR value is typically in terms of index points. An ATR of 0.0065 would mean the index has been moving an average of 0.65 points over the 14 periods.
- And in a forex pair like EUR/USD, an ATR reading of 0.0065 typically means that the currency pair has an average movement of 65 pips over the last 14 periods. This in turn indicates that you can expect price to move 65 pips on the current day.
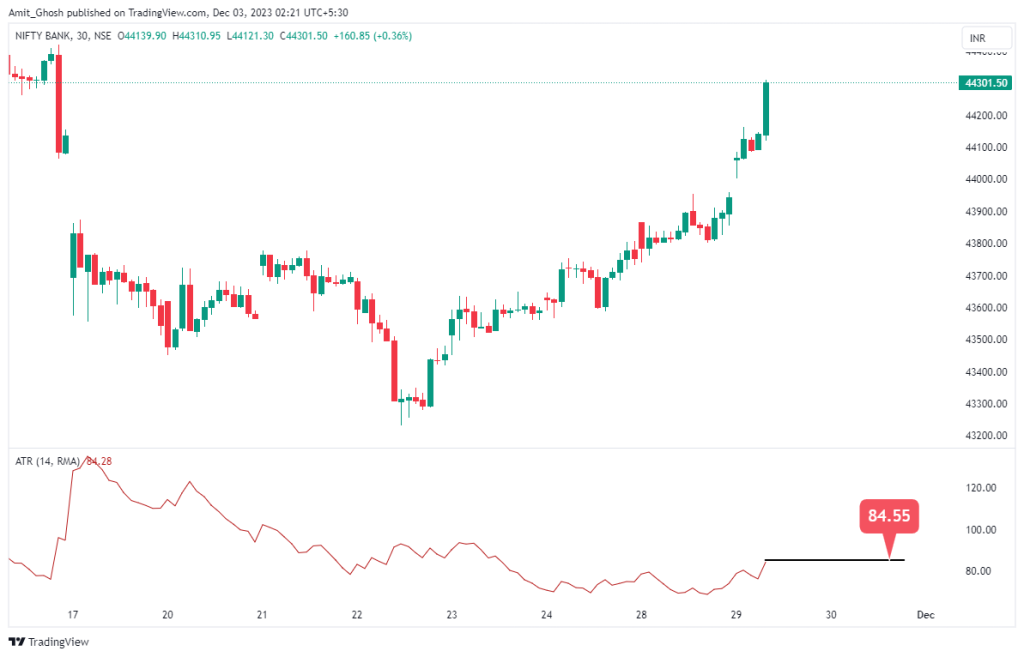
As per the above chart, The Average True Range (ATR) of 84.55 on a 30-minute Bank Nifty chart with a 14-period setting provides information about the market’s recent volatility but doesn’t predict specific price movements.
An ATR of 84.55 suggests that recently, the price of Bank Nifty has been fluctuating within an 84.55-point range on average per 30-minute period. So, While the ATR doesn’t predict future price movements, traders often use it to gauge the potential range for the day. If the market conditions remain similar to the recent past, you might expect similar levels of volatility. However, this is not a prediction; it’s more about setting expectations based on recent market behavior.
Of course, the volatility of an asset can rise and fall. It is important to remember that the ATR indicator does not show you which way price is moving.
How to use the ATR indicator for trading
Target Placement
Stoploss Placement
To use the ATR for stop loss placement, you should look at the indicator’s reading when you enter your trade, then place your stop loss an equal amount of pips from your entry. For example, if as you enter a long trade the ATR reads 100 points, you should place your stop loss 100 points below your entry.
Again, the reverse is true for a short trade.
Using ATR in this way for stop loss placement allows you to avoid any market noise.
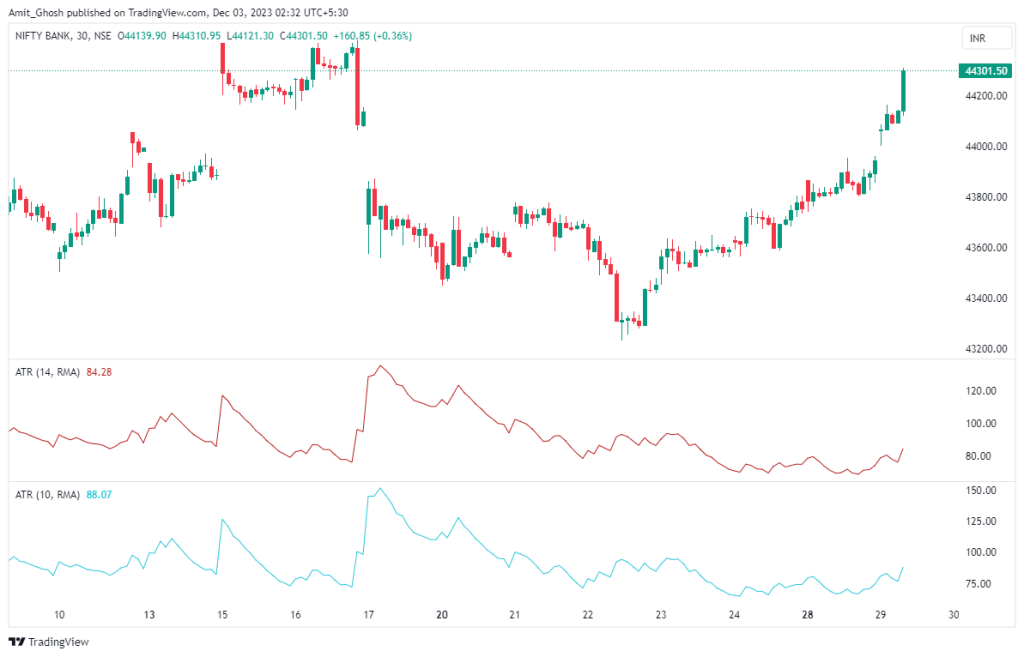
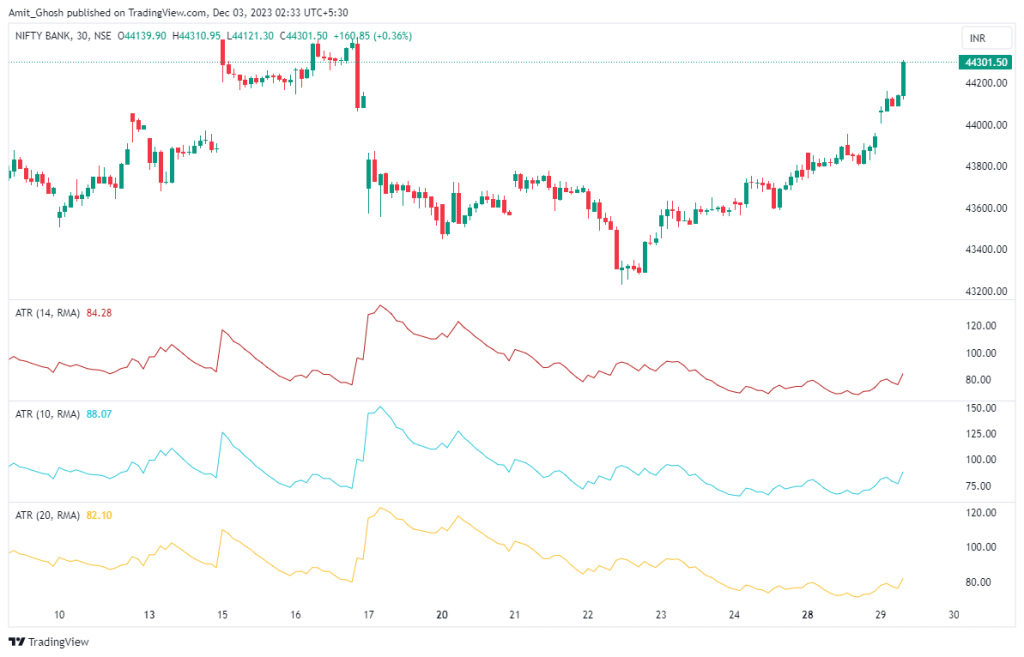
Changing the ATR Period Settings
You can change the setting of the ATR indicator, but it is important to remember that doing so will affect its sensitivity. As an example, imagine your ATR is set at 14. If you change the setting to 10, this will reduce the amount of periods on which the indicator bases its calculation.
This will make it more sensitive to price movements and produce a choppier ATR reading.
Conclusion
- The ATR indicator can be used to set stop losses and profit targets.
- It measures the volatility of the price of an asset over time.
- Altering the ATR setting will increase or decrease its sensitivity to price movements.
- You should manually back test any changes you make to your ATR indicator to check their effects.
Mathematical Clarification on Target and Stop Loss
Let’s clarify how the Average True Range (ATR) can be accurately used for setting stop losses and targets, especially in the context of an instrument like Bank Nifty where the current ATR is 84:
Using ATR for Stop Loss:
- The ATR value gives an indication of the average volatility of the asset. With an ATR of 84, it suggests that Bank Nifty has been moving an average of 84 points per period (e.g., day, hour, etc., depending on the chart’s time frame). In this case, it is 30 minutes timeframe.
- To set a stop loss using the ATR, you would typically place it a certain multiple of the ATR away from your entry point. For example, if you’re more conservative, you might set a stop loss at 1x ATR (84 points) away. This means if you buy Bank Nifty at 35,000, you might set a stop loss at 34,916.
- The idea is to allow your trade enough room to move with Bank Nifty’s normal volatility without getting stopped out prematurely.
Using ATR for Profit Targets:
- Similarly, you can use the ATR to set a realistic profit target. For example, if you’re aiming for a 1:1 risk-reward ratio and you’ve set your stop loss 84 points away, you might also set your profit target 84 points away from your entry point.
- This doesn’t mean the price will definitely hit your target on that period i.e. next 30 minutes; rather, it’s an estimation based on recent average volatility.
Remember:
- The ATR doesn’t predict the direction of the price movement. It only tells you about the asset’s recent volatility.
- The actual use of ATR for stop losses and targets should align with your overall trading strategy, risk tolerance, and the specific context of the market and the asset you are trading.
- It’s important to test and adjust your use of ATR based on actual trading experiences and outcomes, especially in a market as dynamic as the Bank Nifty.
So, while the ATR provides a guideline based on past volatility, it’s essential to use this tool as part of a broader, well-considered trading strategy.