
Support and resistance are points on the chart where the maximum amount of buying and selling is expected.
Support
As the name suggests, support is something that prevents the price of a security to fall further. It is the level in the chart where maximum buying pressure is present.
There can be some instances that price of a stock fall till a support level, consolidate for some time and again start afresh move up. It is an important level in the chart which traders and investors look upon to take a new position.
Let’s take an example of HDFCBANK.
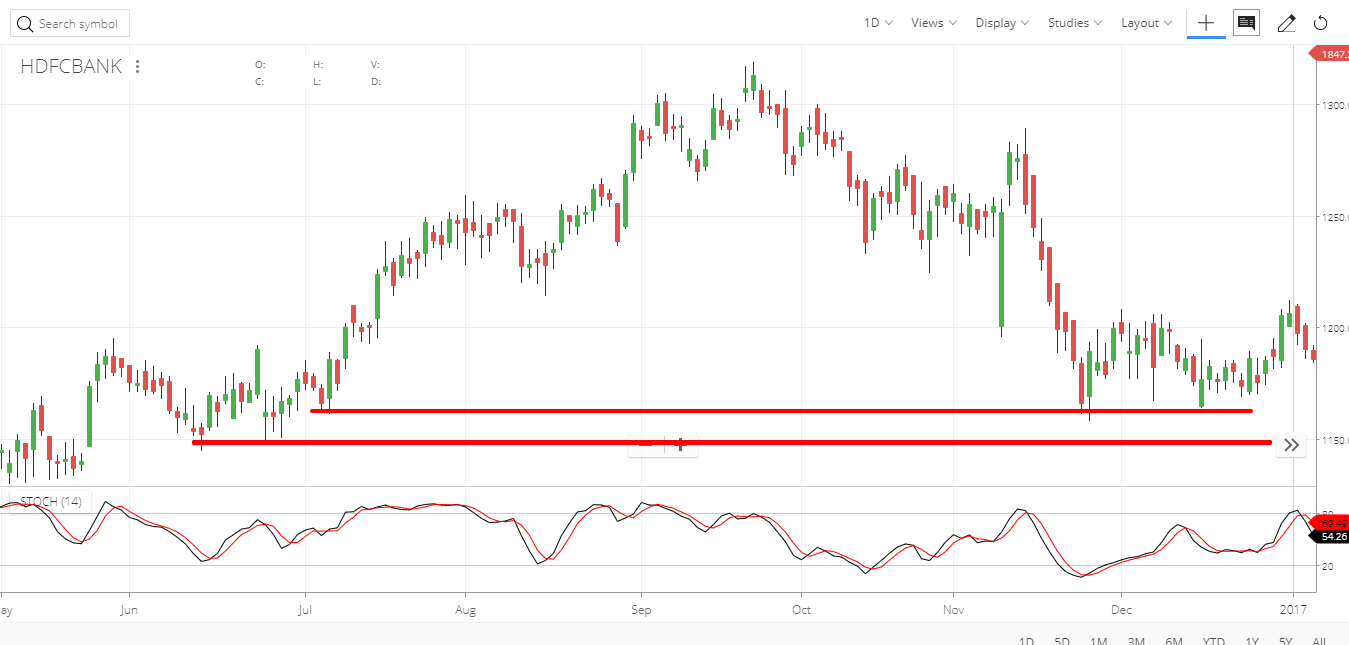
As shown in the above figure, HDFC Bank started a downtrend and then downtrend stopped at the first line which is drawn from the top. This is known as support level 1.
Another support level is below line 1(a.k.a Support 1) Lower support is a major support called Support 2.
One can enter the trade at support 1 taking the stop-loss slight below the support 2 and ride the sweet up move.
Sometimes there are instances like stock moves up straight and consolidates for some time and then start a fresh up move and this consolidation becomes support range of price and then the stock may open gap up and start a new trend.
As shown in below example of TCS.
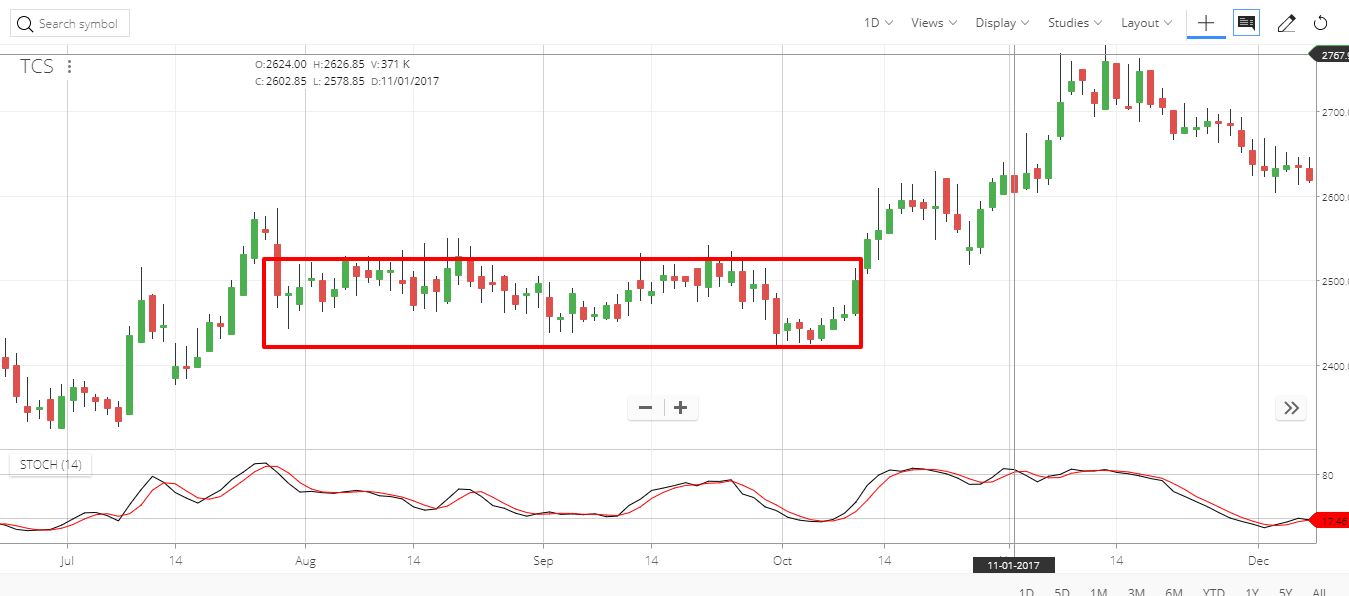
After creating an upward rally, stock price consolidated for some time in a particular range of 2440-2540 and after breaking that it gaped up and again started a fresh up move. This is also known as breakout and this consolidation zone now act as a support zone.
One can take a new position after a gap up and put a stop loss at the low of consolidation zone and ride the steady upward move.
Resistance
As the name suggests, resistance is something that prevents the price of the security to rise further. It is the level in the chart where maximum selling pressure is present…
There can be instances where the price of a stock rise at a particular level but after that, it consolidates. Once there, it won’t be able to rise further, this level is known as resistance point of that stock. Resistance can be a zone of price as well, in which stock price get consolidated.
Let’s understand with an example of PCJEWELLER.
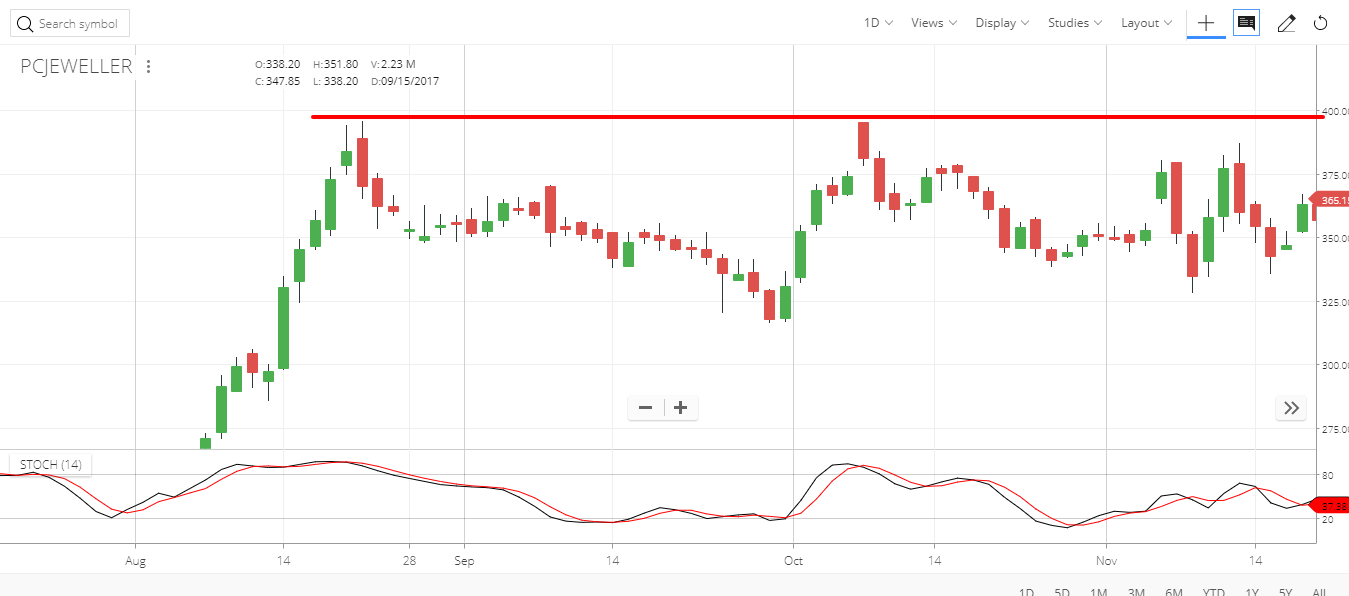
As shown in the above chart of PCJEWELLER, red line act as a resistance zone. The Stock price went up to that level and has reversed after touching the resistance line.
One can exit from the current position or can create a new sell position to ride this movement.
Let’s take another example of ITC.
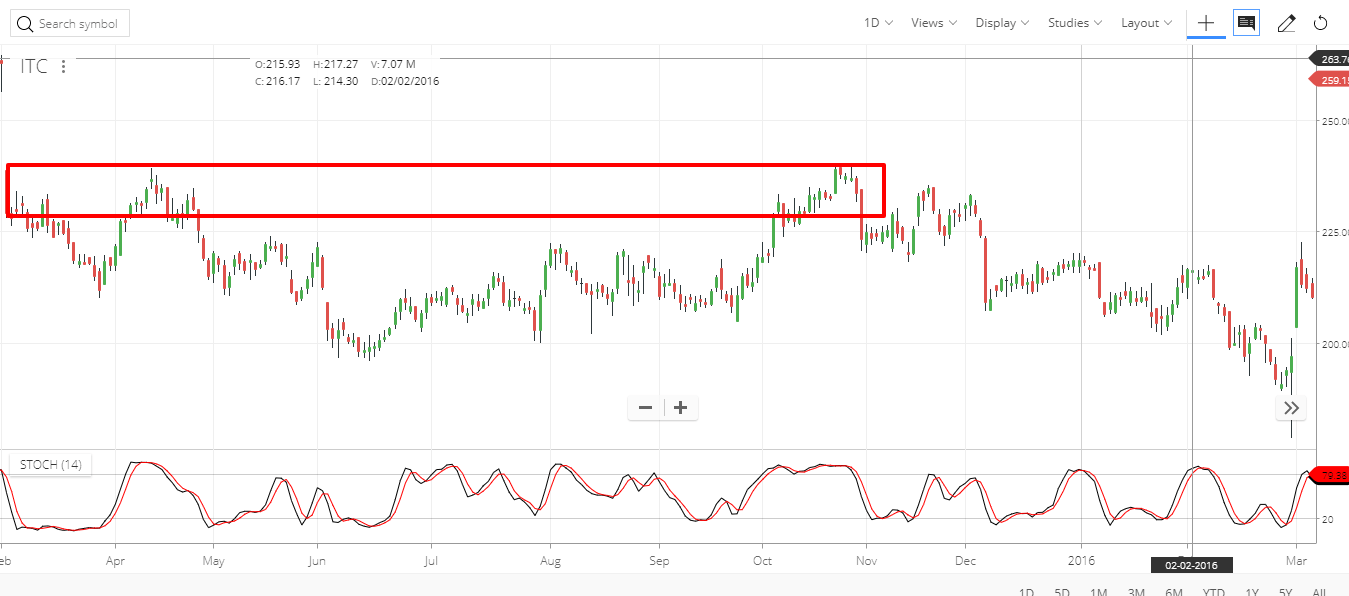
As shown in the above figure, the red box shows the resistance zone. Price test this zone repeatedly and reverse from that resistance zone.
One can trade in this consolidating zone or can initiate a new short position with a stop loss as high in the consolidation zone.
Point to remember: Once the support is broken it will act as resistance and once the resistance is broken it will act as a support.
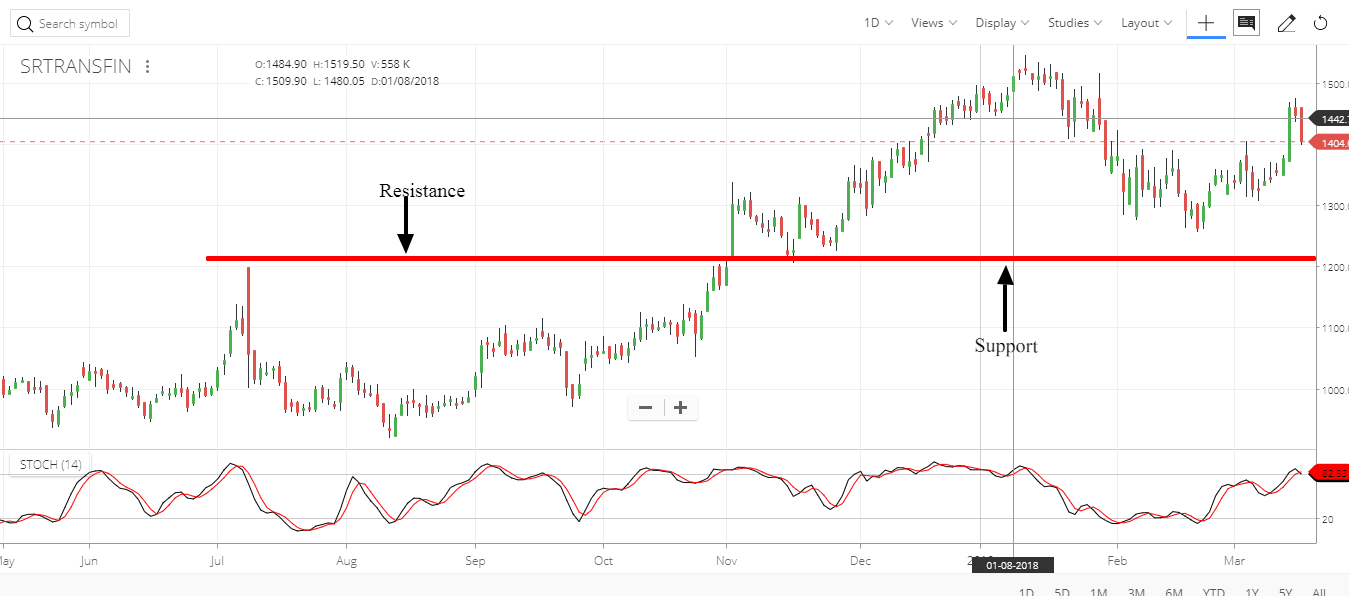
As shown above image of SRTRANSFIN the red line was acting as a resistance, after breaching it, the stock gapped up. The same line becomes the new support for the stock.
Now that price level will act as a support level.
Trading with Support and Resistance
- First, find support and resistance.
- Mark price action points at which trend triggers.
- Trade in the direction of the trend.
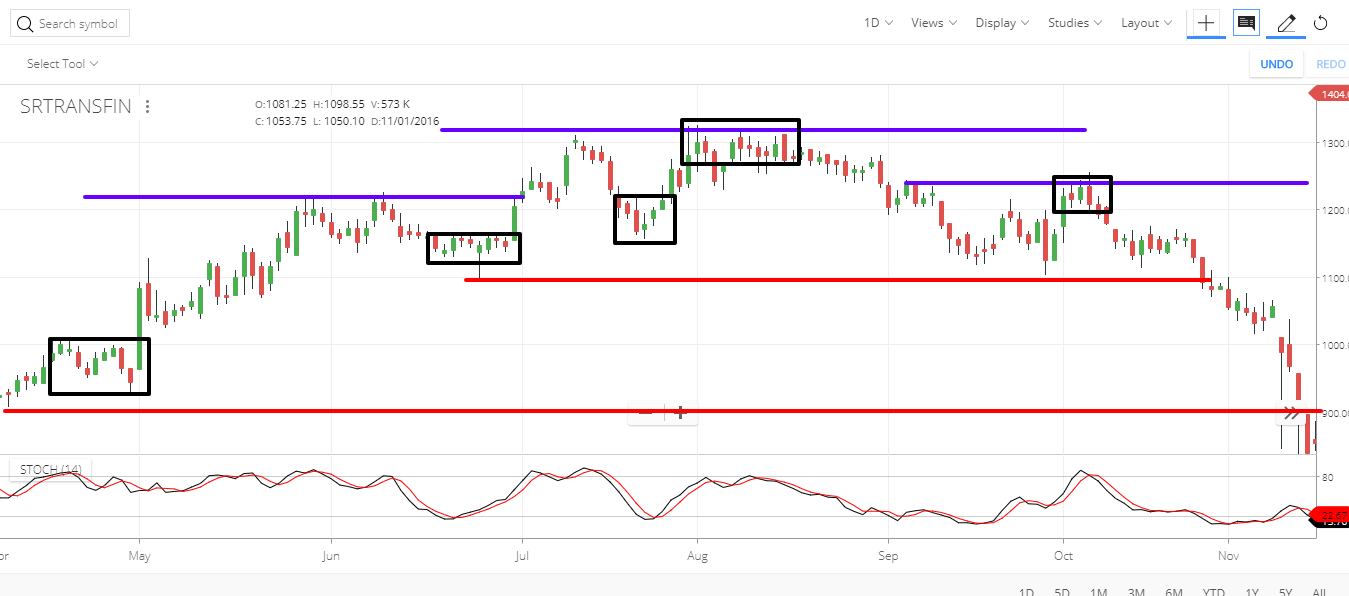
As shown in the above image of SRTRANSFIN let’s understand the trade using support and resistance.
The red lines act as a support, blue lines act as a resistance and black rectangles are various price action points from where the trends can be traded.
- As shown in the image, long can be initiated from the first black rectangle as it is near the support line with stop loss slight below support line.
- Again long can be initiated from the second black rectangle as it is again near the support line.
- A third square rectangle is slightly above the support line so a risk-averse trader can avoid the trade and risk taker trader will take a new long position with stop loss.
- Now from the image, it can be said that stock price tested resistance level too many times but it is not able to breach it. So a short position can be initiated near fourth black rectangle and can be exited near support line.
- Another short can be initiated at weaker resistance near the last black rectangle with stop loss.
This is how Support and Resistance can be used as deciding entry and exit of the trades.
San-Ku Three Gaps up
As mentioned in candlestick analysis number 3 plays an important role. Many signals contain a group of 3 individual signals. So it has become a deeply rooted number for a trader and investor community.
San-Ku provides the best opportunity for buying and selling signals. As the name suggests it is the combination of three gap up.
After observing the bottom signals, the first gap up shows the buyers have entered the long position. The second gap up shows the further enthusiasm of fresh buyers but, this could be a combination of fresh buy as well as short covering. The third gap up shows the shorters finally realized that this is too forceful for them to keep holding short positions.
The Japanese candlestick analyzer recommends that the position should be closed as the stock reached into overbought area and reversal can happen at any time.
Let’s understand with the example of LT.
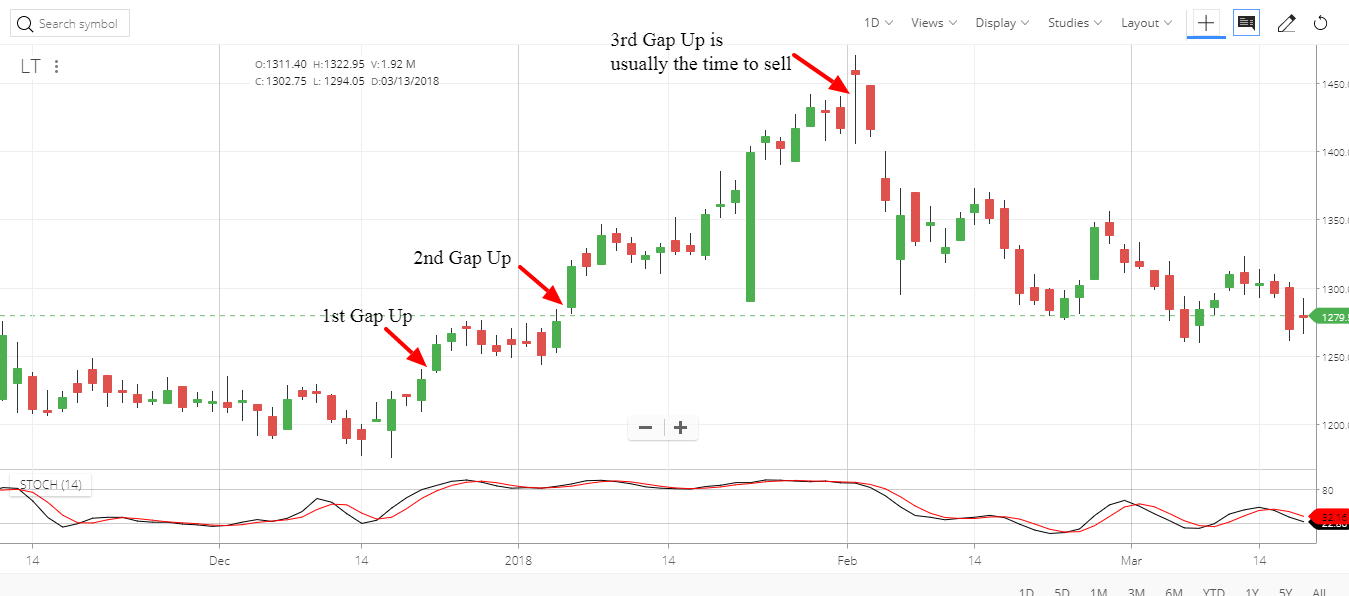
As shown in above figure, after the first gap up price is getting consolidated and not going down which creates 2nd gap up and probably shorters decided that the trend is now finally changed and they exited their short position and that created 3rd gap up.
As the rule suggests exit after the third gap up. There can be the situation that you might have gained more if you hadn’t exited but why to risk more for a very small gain? Go and find another trade opportunity.
Dumpling Top and Fry Pan Bottoms
Dumpling Top
Sometimes a Gap is required for confirmation of a trend or direction of price movement. Otherwise, a move doesn’t create any sign for the direction of a trend.
Dumpling Top is a perfect example.
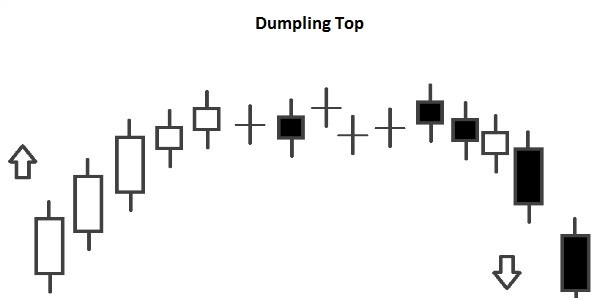
As shown in above figure the slow curvature of candles don’t create any signal for a particular direction, but the gap down at right side candle suggests downward move.
Let’s take an example of HDFC.
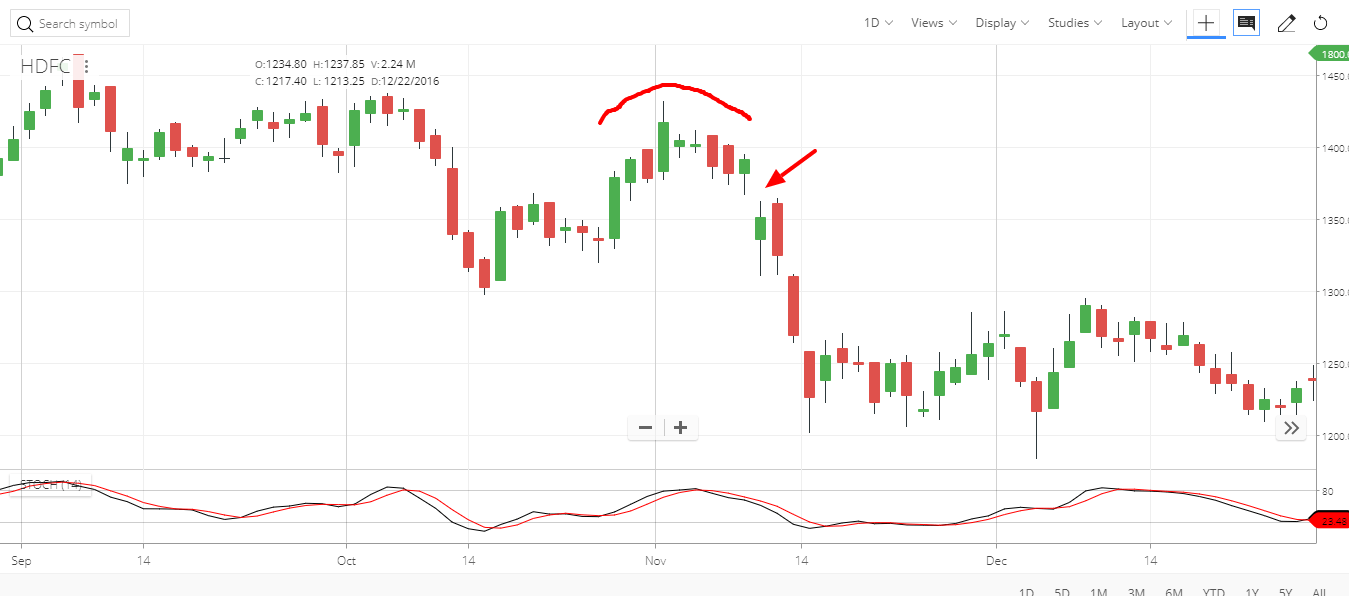
As shown in above example of HDFC dumpling top created followed by a huge gap down which created a downtrend for the short term. In this pattern gap is the alert for starting of a trend.
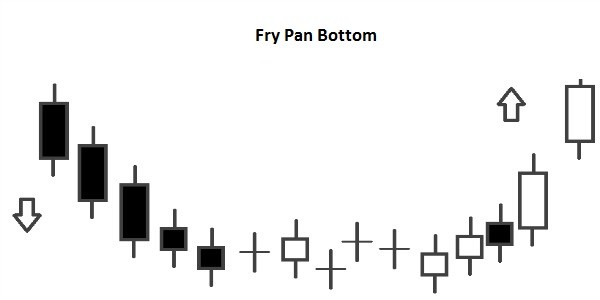
Fry Pan Bottom
Fry Pan Bottom is the reversal of Dumpling Top only. In this case, a slow curvature of candles followed by a Gap up which clears the direction of the trend.
Let’s understand this with an example of TORNTPHARM.
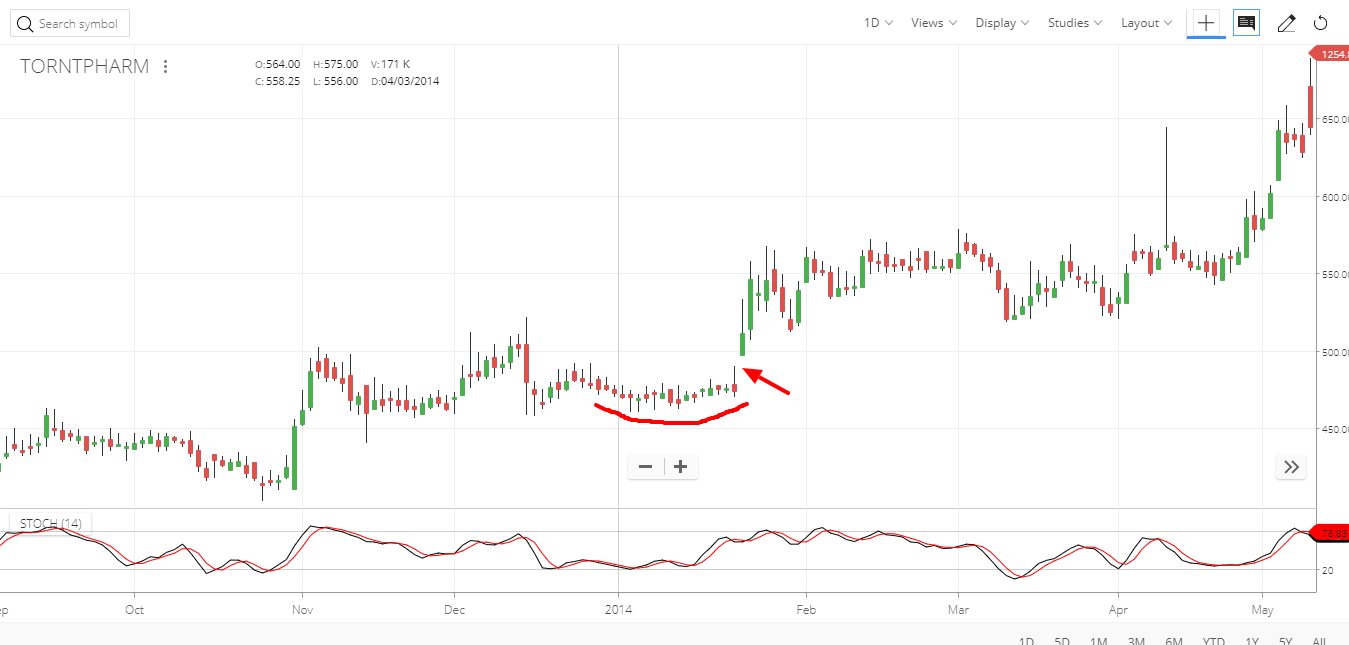
As shown in above figure Fry Pan Bottom created in the stock and it is followed by a huge Gap which triggered a massive uptrend.
In this, both pattern Gap triggers the direction of the trend from an undecided direction.