Trend Analysis – Downtrend

Here goes the classic definition –
When a scrip makes lower highs and lower lows; that scrip is considered to be in a downtrend. We spot downtrend using the LHLL (Lower High Lower Low) Pattern.
Similarly, like uptrend,
- Price makes an initial move.
- Then, it pulls up making a high. It is called a retracement.
- Now, if it breaks the low it made previously; Lower Low is achieved.
- Now to complete the whole setup, it can not retrace more than the previously made high! It has to breach the Lower Low which will confirm the Lower High.
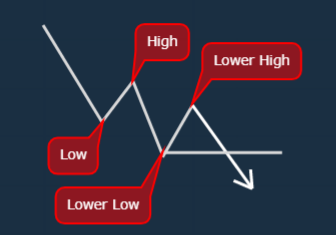
The moment it breaks the Lower Low, We can tell that our Lower High is confirmed.
Hence, Downtrend is confirmed!
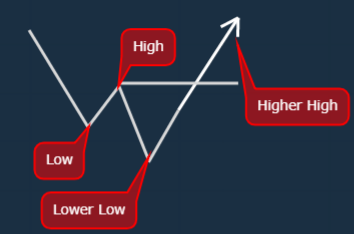
In case the scrip breaches previous High without breaching Lower Low; then it will automatically make Higher High only. This invalidates our LHLL Pattern.
Let’s have a look at an example –
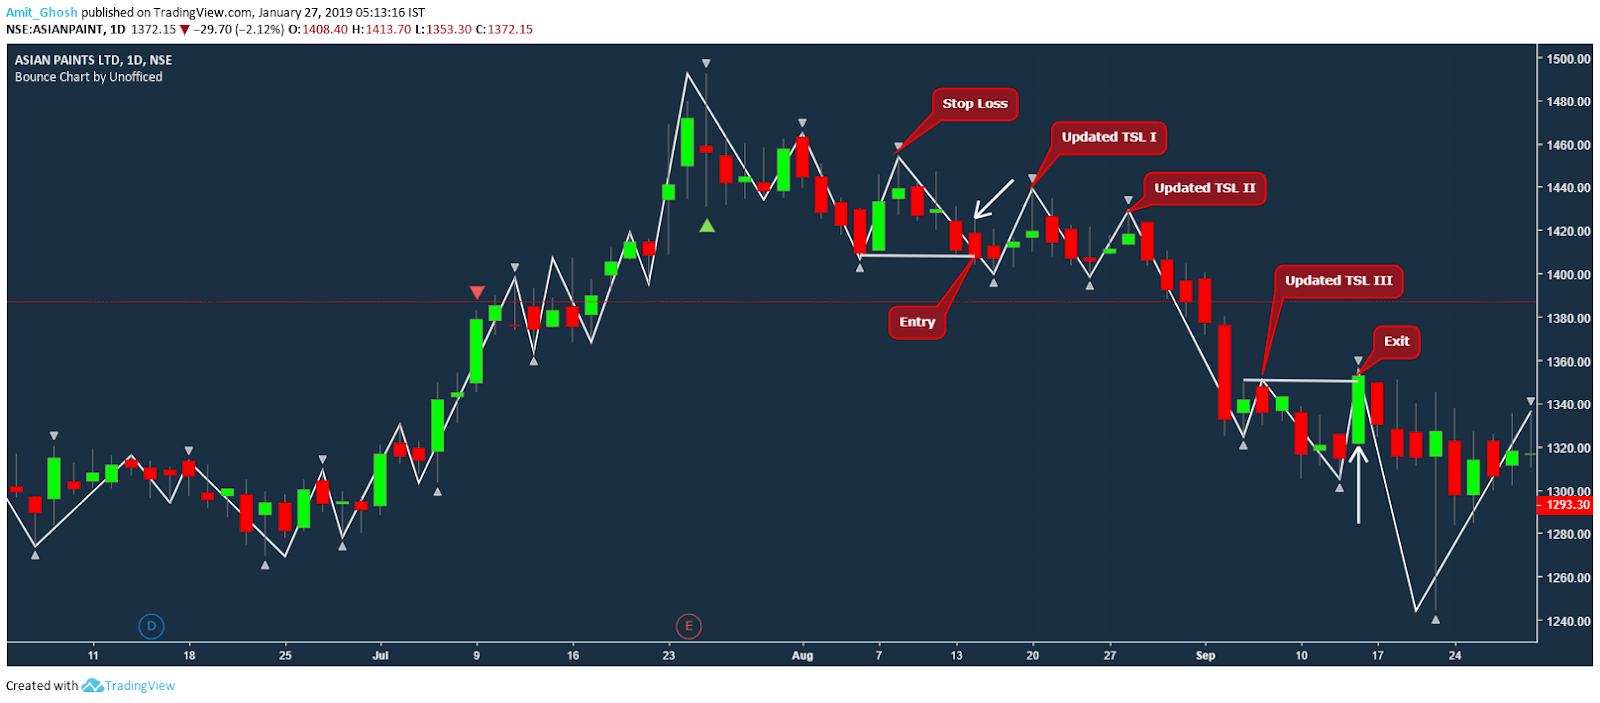
In the below chart, one can see the Downtrend has beautifully triggered.
We’re netting a profit of (1394.7-1331.95) = 62.75 points which are roughly 4.50% from our entry point. The risk taken here is the initial stop loss i.e. (1447.65- 1394.7) = 52.95 points which are roughly 3.80%. After the initial stop loss update, the trade becomes risk-free!
Let’s summarize the whole trading activity in our aforesaid plan –
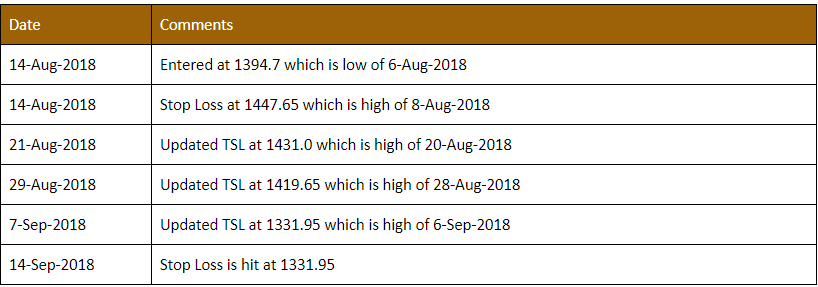
The opposite case of trade management is being practised here!
To trail the stop loss in a short position, one need to trail the stop loss above the recent Lower High. In the same way, when a retracement is made (a new low is created in this case) we need to move our stop loss more down for better profitability. Once the Lower High is broken, it is a Higher High and hence the stock is no more in downtrend!
In the next few charts, let’s try to gauge where people would keep their stop-loss if they have short in the scrip. In this case, even, without any indicator to mark peaks and troughs; if one defines where all shorters or majority shorters will exit a trade in a downtrend with a proper rationale; we can consider that as a peak.
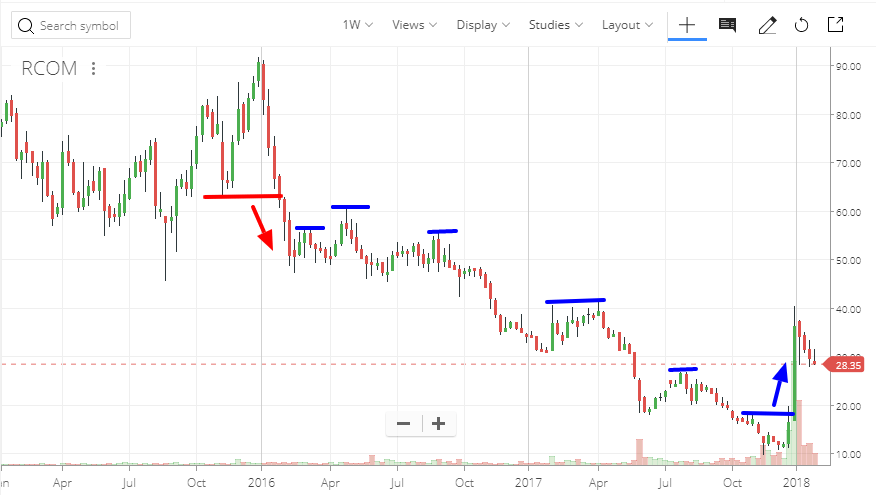
Here goes the weekly chart of Reliance Communications which is in a downtrend since October 2016. The blue lines are the Lower Lows or Peaks in this Swing Chart. However, Reliance Communications also broke out from the downtrend. Look at the strength of the breakout irrespective of the reason of breaking out!
The first Swing High itself got broken in the next Swing High making a false breakout at the very beginning of the trade but we can either avoid that or we can take re-entry as shown here.
A good amount of retracement was anyways due when the stock already fell massively straight seven weeks! When a stock goes up in an uptrend or goes down in a downtrend for quite a time, it tends to produce false breakdowns or breakouts!
Why? A scrip can go up or fall down for “quite a time” only if it has a fundamental catalyst. In this case, it momentarily broke the downtrend, became a sideways trend and resumed the downtrend breaking the lower range of the downtrend.
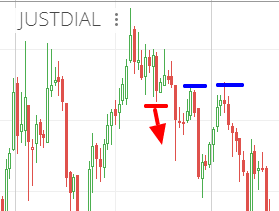 Here goes another case of Justdial which got stop loss hit at the very second swing. This trade is an emotional disaster. To maintain discipline the trader saw the stock going to 1250 and the huge profit turned into a loss when it went to 1650.
Rules can’t be broken in a system. But it gave a chance of re-entry again which is way below the stop point. This creates an emotional pressure that one could have saved the realized loss if there is no stop loss in the system. Many wait for the price to go above their exit price to short again which is completely wrong as it can keep falling missing them the profit run.
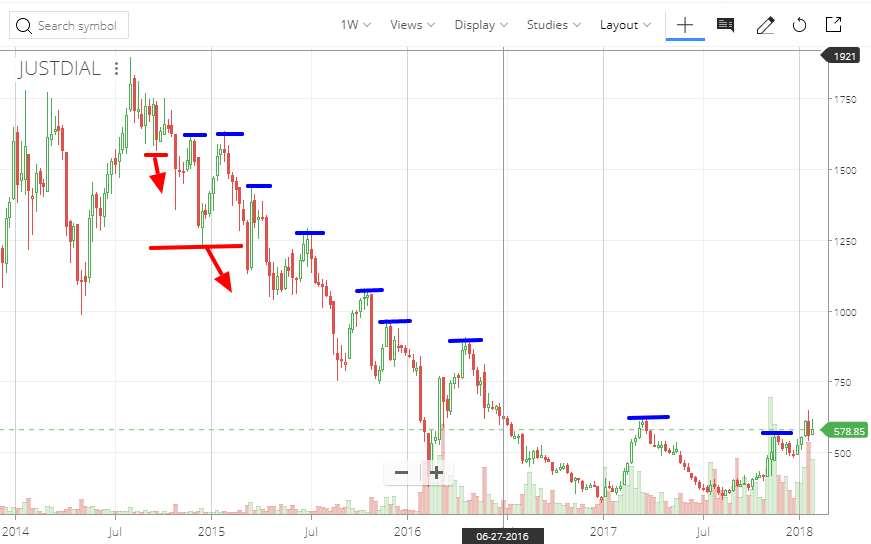
With simultaneous use of lower time frames, one can exit the trade in between only to re-enter higher if one has the time to monitor this scrip maximizing the profit. But again, micromanagement leads to loss as well. Now Just dial is on verge of breakout or false breakout. It would most probably be a false breakout as we don’t see the buying momentum as we saw in Reliance Communications.
On a different note, always respect the higher timeframe more than the lower timeframe. It increases the probability of profit.
If you short a scrip intraday which is on a downtrend in both weekly and daily time frame then it is more favourable than a scrip which is in an uptrend on weekly and downtrend in daily. The more false breakouts the weaker the trend is. False breakout signifies bulls are just waiting for a ride to the moon on a given chance!
Here is a nice example showcasing a mistake in the trade –
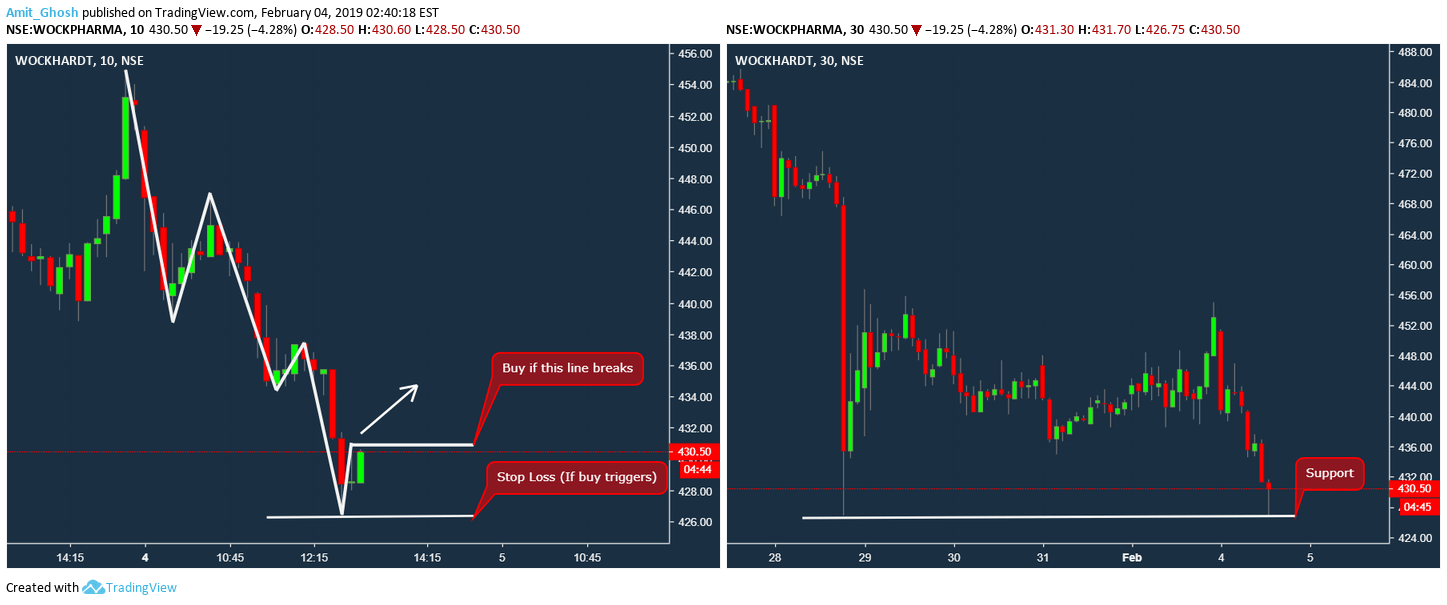
This is the chart of Wockhardt –
- Higher Timeframe – It is in the lower channel of a sideways trend.
- Lower timeframe – Downtrend looks weak and the last lower high is about to break.
So, from both timeframes, it is looking bullish. But, in the lower time frame, we are marking the green candle as a lower high. But to confirm a candle lower high we need their neighbour candles to declare that it is a Swing High or not.
Basically, we were supposed to wait for the lower high to confirm!
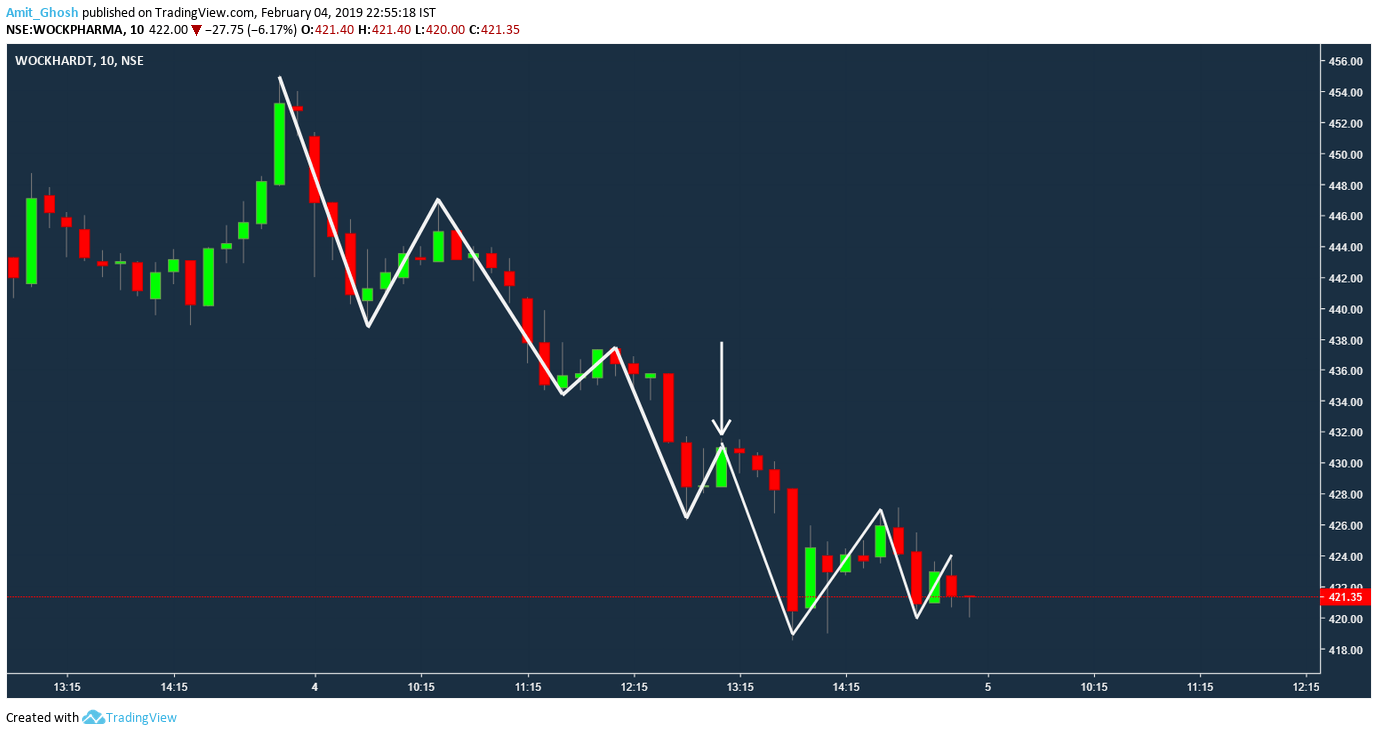
It created a lower high and continued to fall with the downtrend.
But our entry triggered! And, due to impatience will be costing money. So, we need to always wait for one candle for confirmation of peaks and troughs!