Gap up and gap down in a candlestick chart
Witnessing a gap or window at the beginning of a new trend produces profitable trade opportunities.
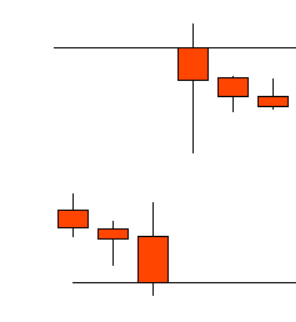
Gap Up
Gap up is an opening of a stock price higher than the previous day’s trading range. It shows the buyer’s enthusiasm to buy that stock at a price higher than the previous day’s closing price. It can occur because of some positive news overnight or some fundamental event occurred within the company.
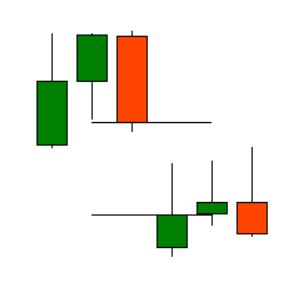
Gap Down
Gap down is an opening of stock price lower than the previous day’s trading range. It shows sellers are in power to sell that particular stock at a price lower than the previous day’s closing price. It can occur because of negative sentiment or news overnight.
A Simple representation of Gap down is shown in the left.
Trading with Gap up and Gap down
A gap at the Bottom
As we know, gaps represent the enthusiasm of buyers or sellers for getting into or getting out of a stock position which creates a new trend.
Seeing a potential candlestick BUY signal at the bottom of an extended downtrend is a great place to buy.
Gap up at bottom of a downtrend is the best place to buy that particular stock.
Let’s take an example of Reliance –
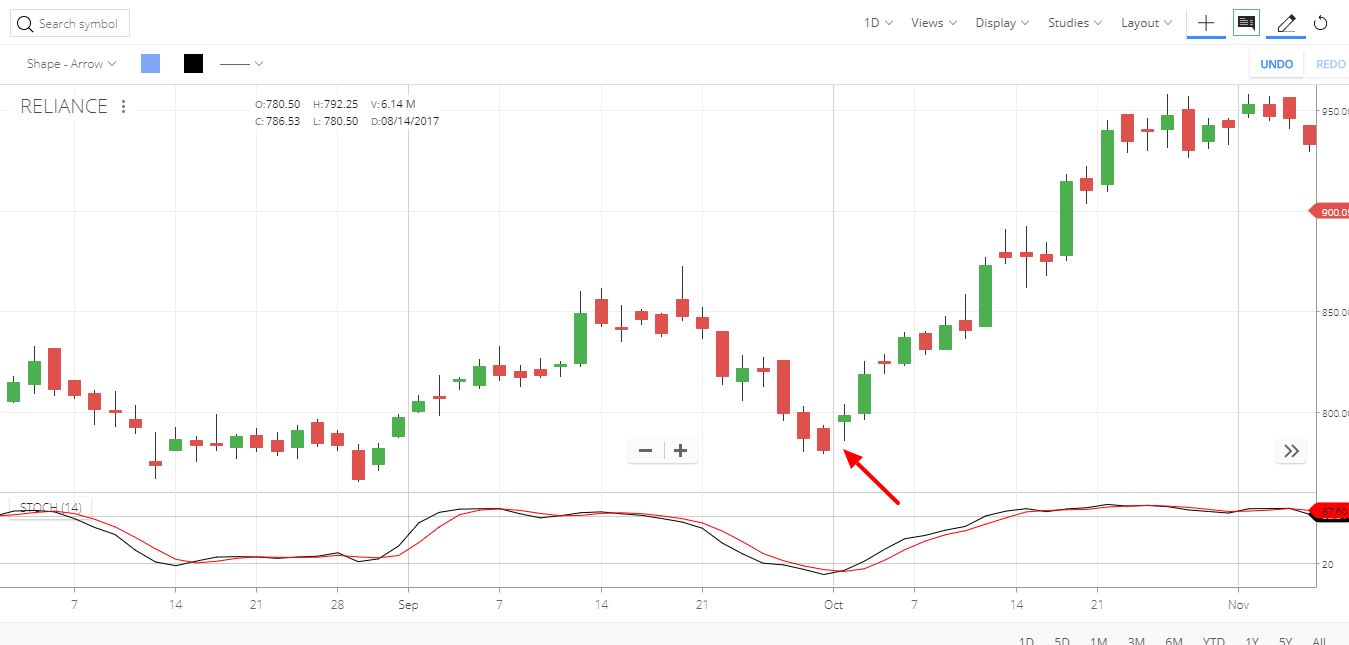
In the above example of RELIANCE, the gap up at the end of downtrend happened as shown with the Arrow.
There might be some downward movements as traders start booking profits at this juicy gap ups, but after that, you can see straight upward rally giving whooping 20% return in a month.
Let’s take another example of Auropharma –
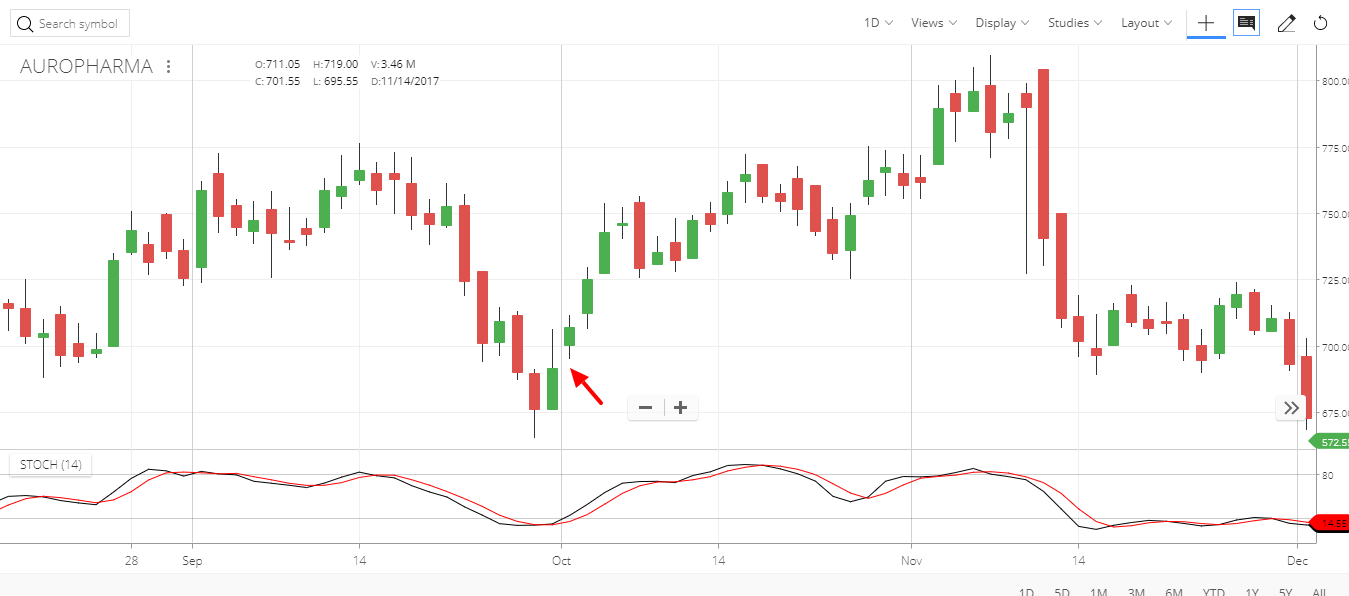
AUROPHARMA was in a downtrend, and it opened with a gap up as shown with the red arrow. After which a big rally of sweet 15% followed.
Recently Axis Bank had fallen significantly, it was followed by some bad news and after that gap up formed at the bottom of the downtrend as shown with an arrow. Evening star signal at the end is an obvious trend reversal signal which is followed by a huge gap up.
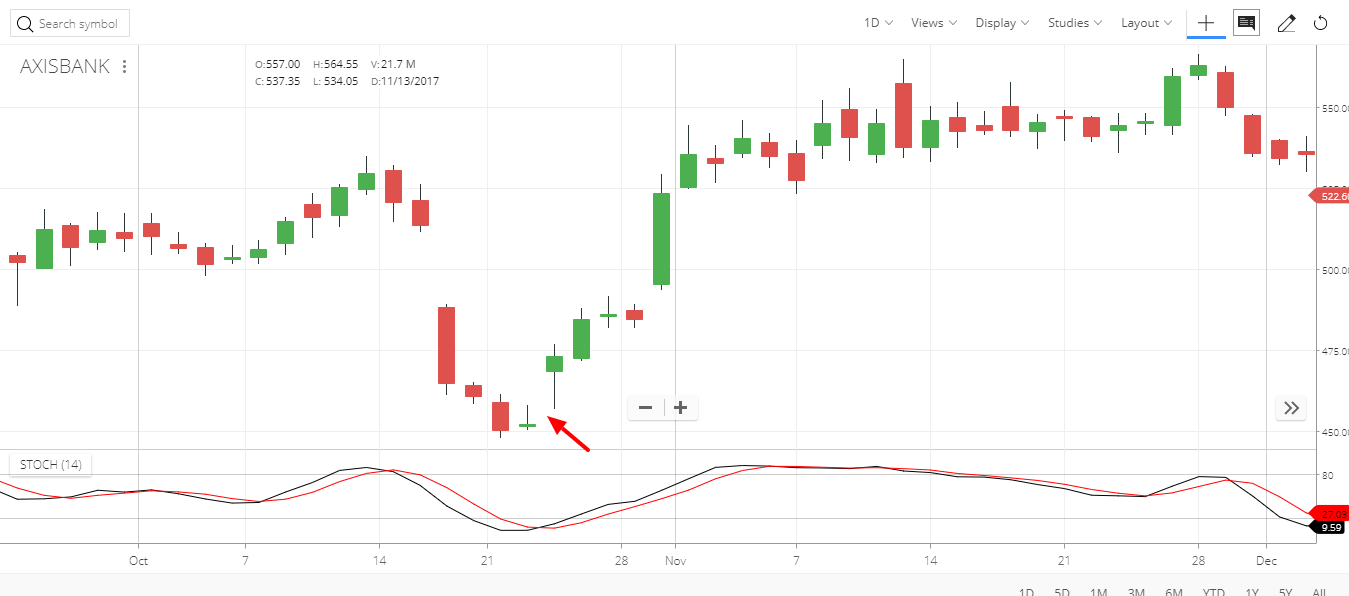
Entry after gap up has given nearly 20% return in a month.
One can add other indicators like Stochastic to get a precise decision. Like, buy when stochastic shows the stock is in oversold condition.
Many investors are afraid of buying after a gap up because they don’t want to pay for a stock that has moved significantly 2%, 3% or 5% in a single move although this 2%, 3% or 5% can be the starting of 30% or 40%.
So, one can have a technical stop loss to exit the position if it’s a false signal. The stop loss would be at previous day’s low.
Sometimes you will witness a gap up opening at the bottom of a downtrend. The next candle creates doji which represent indecision of the direction. When the stock price gaps up again after indecision day, with strong volume, it indicates that bulls have taken control over bears and the indecision. This shows that the sellers are now finished.
Upon witnessing a gap up, an individual signal such as dark candle or doji after a gap up has less relevance. When a large gap occurs, it is not unusual to see immediate selling as the traders take their quick profit. The overall message is that the bulls are in command. The next few days demonstrate that the price was not going to back, the new trend had started.
The gap at the Top
The gap that appears at the top of a trend provides ominous information. Remembering the mental state of most investors, the enthusiasm builds as the trend continues over a period of time. Each day the price continues to go up, the more investors become convinced that the price is going to go through the roof. The “talking heads” on the financial stations start to show their prowess. They come up with a multitude of reasons why the price had already moved and will continue to move into the rosy future.
With all this enthusiasm around, the stock price gaps up. Unfortunately, this is usually the top. Fortunately, Candlestick investors recognize this. They can put on exit strategies that will capture a good portion of the price movement at the top. Consider the different possibilities that can happen when witnessing the gap up at the top of a sustained uptrend. Most of the time the gap will represent the exhaustion of the trend, thus called an Exhaustion Gap. Or it could be the start of a Three Rising Windows formation. Or big news, a buyout or a huge contract is about to be announced.
What are the best ways to participate in the new potential, if any, at the same time knowing that the probabilities are that the top is in?
A few simple stop-loss procedures can allow you to comfortably let the price move and benefit from the maximum potential. Hopefully, in the description of the gaps occurring at the exuberance of an extended trend, you have already experienced a substantial gain in the position. Any gap up is adding to an already big gain. Probabilities dictate that this is the top. Possibilities could include more upside gains.
Upon a slight to medium gap up, the Candlestick investor should put their stop at the close of the previous day. The logic being that if the price gapped up, indicating that the top is in, and the price came back down through the close of the previous day, the buying was not sustained. If so, the stop closed the position at the level of the highest close in that trend.
Gap down at the top of an uptrend is the best way to exit from the trade or take a new short position.
As we have seen in case of gap up, that it is the best place to buy the stock. Same in case of gap downs at the top. This setup is the best place to sell the stock.
As shown in below image, HDFC was in an uptrend and then a big red candle formed followed by a gap down, which is our sweet spot.
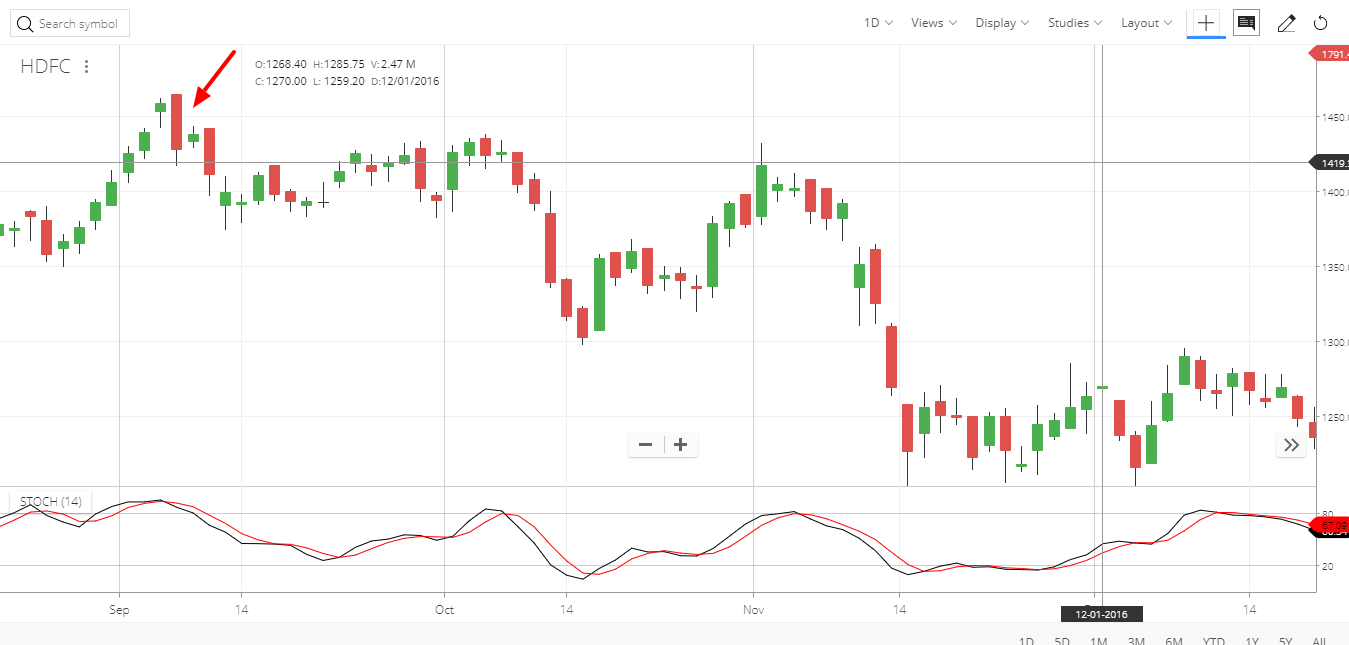
Entering after the gap down shown by red arrow had given 18% return in 2 months time.
Let’s take an example of BAJAJ FIN. It has created a very huge gap down on 12/09/2016.
We can enter at the closing of same candle end keep the stop loss as previous day’s high for our safety.
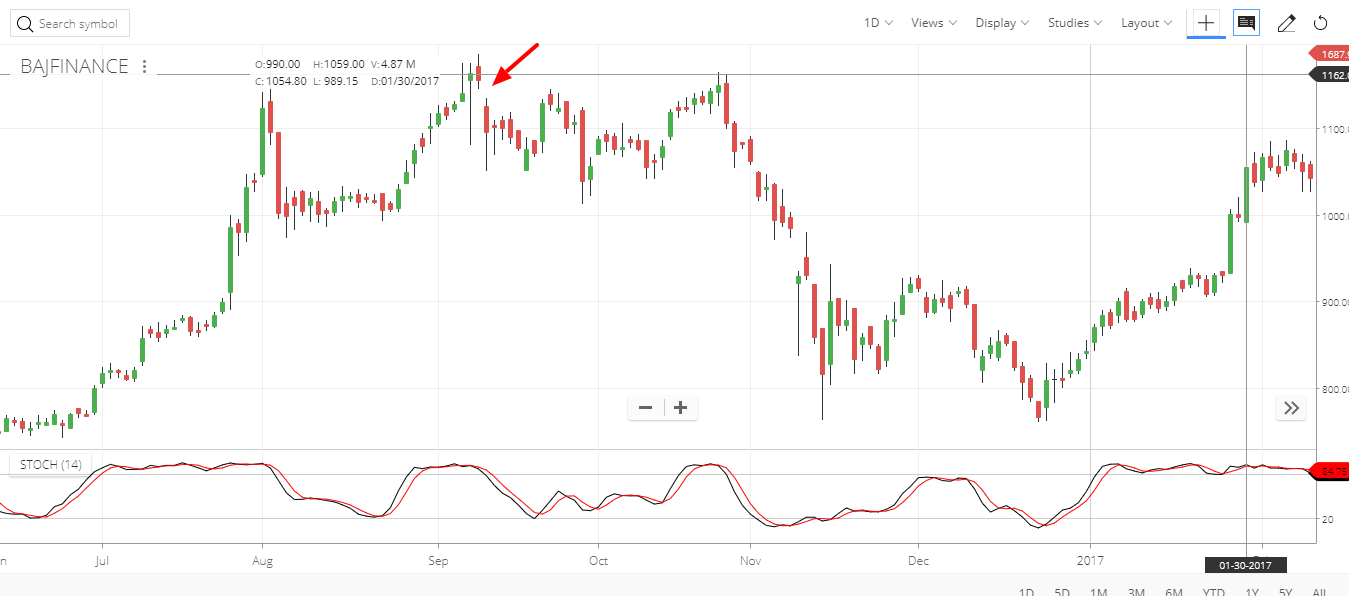
That was a smooth down move, and it moved 31% in a span of just 2 months.
Recently same pattern occurred in BANK NIFTY index.
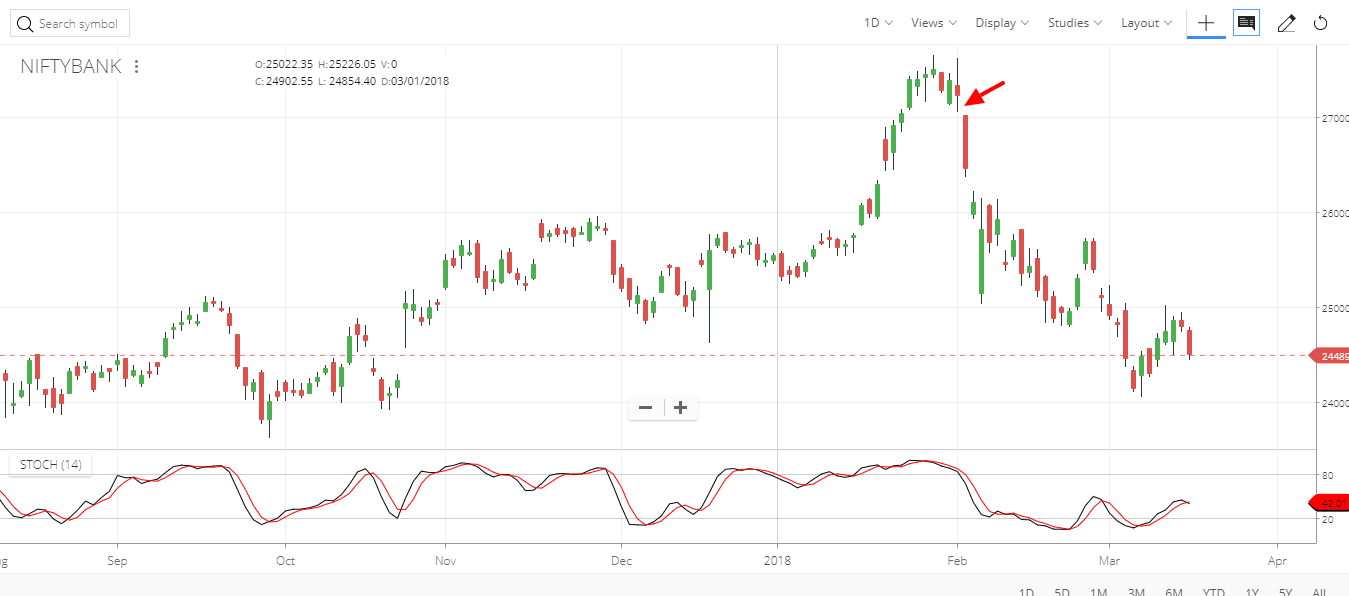
As shown with the red arrow in the above image, it created huge gap down followed by a smooth downtrend and still, BANKNIFTY is in downtrend falling with huge volume.
Some of the observations that Candlestick analysis reveals, as found in “Profitable Candlestick Trading”, the Japanese could not only identify when a reversal was occurring, they could describe the trading environment that would anticipate the reversal.
For example, using candlestick formations, it was clearly obvious that after an extended downtrend, the fear and panic would start to exaggerate. The daily trading range would expand as more investors panicked and liquidated their positions. This series of events would forewarn the Candlestick investor that the bottom was getting near, and to be vigilant for a buy signal. The most informative signal at the bottom of one of these declines is the gap.
For example, a stock has been in a downtrend for weeks. The talking heads on the financial stations are all expressing their opinions about how this company/industry is in the trash can. There is no reason to own this stock. Finally the last holdouts cannot stand the pain of owning that stock anymore. They get out at any cost. The price gaps down the next morning. Once this gap is spotted, a variety of profitable trading procedures can be put in place.
What can happen from this point?
The price has gapped down after weeks of a lengthy decline. If it is a mild gap down, the price may keep declining. You may start seeing a dramatic increase in volume. The price is showing another big down day. However, the aggressive Candlestick investor realizes that the gap down was a blow-off signal.
Upon seeing the price decline finally hit bottom and appear to stabilize, the aggressive investor can start to accumulate stock. Knowing that the gap was part of the panic selling gives the candlestick investor the confidence to step in when there is still panic in the air.
If the gap down is severe, the panic may all be built into the opening price. A severe gap down open after an extended downtrend may be a good opportunity time to buy.
Watch how the stock price reacts after the open. If it appears to be stabilizing at the open level, with a little downside move that seems to be immediately bought up, it is time to start establishing a position.
At the end of that day, you want to see a green candle, a close much higher than the open. This illustrates that all the sellers have been washed out. The buyers have taken over. This is the advantage that Candlesticks have over other charting techniques. It is much easier to see what is happening in a stock price when the color of the bodies can be viewed.
A stock price that opens down and continues to go lower has a completely different strategy. The purchase of that position may be a few days or weeks down the road.
Traditional portfolio strategies and many financial models like Harry Markowitz’s modern portfolio theory, The Black-Scholes Merton option pricing model. Typically follow the idea that market returns, follow the normal distribution.
Under this assumption, the probability that returns will move between the mean and three standard deviations, either positive or negative, is approximately 99.97%. This means that the probability of returns moving more than three standard deviations beyond the mean is 0.03%.
Tail risk is a form of portfolio risk that arises when the possibility that an investment will move more than three standard deviations.
But Stock market returns tend to follow a normal distribution that has excess kurtosis. So tail risk happens certainly more or less than 0.03%.
Although rare, it may generate huge negative returns. The tail risk may happen on major fundamental news like Brexit. That’s why we always hedge properly and it’s called hedging against the tail risk.
Huge Gap downs and gap ups also fall under tail risk. If one has the position on BANK NIFTY (assuming), it is always good to have hedged against respective CEs and PEs or other hedging methods.